Research - (2022) Volume 13, Issue 5
Abstract
Several publications have raised the issue that the development of diabetes is preceded by alteration of the microbiome (dysbiosis) and hence, the role of environmental factors, triggering dysbiosis, should be considered. Antibiotics are powerful agents inducing dysbiosis and the authors wanted to estimate the possible association between the consumption of different major types of antibiotics and the prevalence of diabetes (Type-1,/T1D/, Type-2 /T2D/) in thirty European countries. According to our hypothesis, if such association exists, the dominant use of certain major antibiotic classes might be reflected in the prevalence of T1D and T2D in different countries.
Comparisons were performed between the prevalence of diabetes (T1D and T2D) estimated for 2019 and featured in the Diabetes Atlas with the average yearly consumption of major antibiotic classes of the previous 10 years (2010-19) calculated from the ECDC yearly reports on antibiotic consumption in Europe. Pearson correlation and variance analysis were used to estimate the possible relationship.
Strong, positive (enhancer) associations were found between the prevalence of T1D and the consumption of tetracycline (J01A/p: 0.001/) and the narrow spectrum penicillin (J01CE/p: 0,006/, CF/p: 0.018/). Strong negative (inhibitor) association was observed with broad-spectrum, beta-lactamase resistant penicillin (J01CR/p: 0.003/), macrolide (J01F/p: 0.008/) and quinolone (J01M/p: 0.001/). T2D showed significant positive associations with cephalosporin (J01D/p: 0.048/) and quinolone (J01M/p: 0.025/), and a non-significant negative association was detected with broad-spectrum, beta-lactamase-sensitive penicillin (J01CA/p: 0.67/).
Countries showing the highest prevalence of diabetes (first 10 positions) showed concordance with the higher consumption of “enhancer” and the lower consumption of “inhibitor” antibiotics (first 10 positions) as indicated by variance analysis. Countries with high prevalence of T1D showed high consumption of tetracycline (p: 0.015), and narrow spectrum, beta-lactamase sensitive penicillin (p: 0.008), and low consumption of “inhibitor” antibiotics (broad-spectrum, beta-lactamase resistant, combination penicillin (p: 0.005), cephalosporin (p: 0.036), and quinolone (p: 0.003). Countries with a high prevalence of T2D consumed more cephalosporin (p: 0.084), quinolone (p: 0.54), and less broad-spectrum, beta-lactamase sensitive penicillin (p: 0.012) than other countries.
The development of diabetes-related dysbiosis might be attached to higher consumption of specific classes of antibiotics, showing positive (enhancer) associations with the prevalence of diabetes, and the low consumption of other classes of antibiotics shoving negative (inhibitory) associations. Those groups of antibiotics are different in T1D and T2D
Keywords
Diabetes type-1 (T1D), Diabetes type-2 (T2D), Antibiotics, Microbiome, Dysbiosis, Prevalence, Concordance
Introduction
T1D and T2D are chronic diseases that develop either when the pancreas could not produce sufficient amount of insulin or when the body cannot utilize the insulin it produces. Hyperglycaemia is a common result of uncontrolled diabetes which leads to serious damage to several organs, particularly the nervous, blood vessels and kidney. Diabetes is one of the largest world-wide public health problems, imposing a heavy global burden on health services (Lin X, et al., 2020).
According to recent data, approximately 60 million inhabitants in Europe are suffering from diabetes, which is 6.3% of the population (age-adjusted) in Europe. Worldwide 1 in 11 adults (20-79 years, 463 million) is suffering from diabetes. Europe has the largest number of youngsters with type 1 diabetes 296,500 in total (IDF, 2021).
Apart from specific categories (gestational, diseases of the exocrine pancreas, drug-or chemical-induced diabetes), two major types of diabetes mellitus could be identified as T1D and T2D. T1D could be characterized as the autoimmune destruction of insulin producing β- cells which usually leads to absolute insulin deficiency. In the cases of T2D, due to a progressive loss of adequate β-cell insulin production based on the background of insulin resistance (American diabetes association, 2020).
The incidence/prevalence of T1D has considerably increased in the past 30 years probably due to changes of the environment that couldn’t be appropriately identified yet. The pathomechanisms leading to the development of T1D cannot be fully explained only by genetic background, but external factors might play part in the development of T1D also. (Rewers M and Ludvigsson J, 2016; Dabelea D, 2009).
T1D is considered as an autoimmune disease, developing as the result of T cell-mediated β cell destruction of the pancreas in genetically susceptible individuals. Several susceptible genes and loci have been found playing part in the development of T1D. HLA regions are considered to contribute about 50% of genetic susceptibility. External factors may change the expression of the genes via epigenetic mechanisms, and promoting the development of T1D in genetically susceptible individuals, but this pathomechanism is not appropriately understood. The development of T1D starts early in the life, and the destruction of insulin producing β-cells, the lack of endogenous insulin causes a life-long need for exogenous insulin therapy (Xie Z, et al., 2020; Atkinson MA, et al., 2014; Knip M, et al., 2017).
T2D is characterized by the imbalance of blood glucose level and it accounts for the 90% of all diabetes cases. It is considered as a frequently detected metabolic disorder which is associated with altered lipid profile, obesity, and high blood pressure. Genetic factors, high energy diet and the lack of physical activity are considered as major risk factors in the development of T2D. Several studies indicated the presence of altered gut flora as a factor in the rapid progression of insulin resistance. In T2D, at the initial phase of the disease, hyperglycemia develops as the result, of the inability of the body’s tissues (cells) to respond fully to insulin, what we call as “insulin resistance”. During this period of insulin resistance, the hormone is ineffective and, it induces more insulin production until the beta-cells can keep up with the demand before exhaustion. T2D is most commonly found in older adults but is increasingly seen in children and younger adults owing to rising levels of obesity, physical inactivity, and inappropriate diet (Sharma S and Tripathib P, 2019).
It is well known that dysbiosis is associated with a wide spectrum of diseases (Barko PC, et al., 2018). T2DM could be linked to the changes of the gut microbiota also. In one study, quantitative PCR analysis indicated that the gut microbial composition in patients with T2D was partially different from that in healthy individuals. Certain taxa of microbiomes, like Faecalibacterium prausnitzii was found to be significantly lower in patients with T2D (p-value=0.038) and Bacteroides fragilis was under-represented in the microbiota of the group with diabetes, but this difference between the two groups was not significant (Moghadam NF, et al., 2017; Zheng Y, et al., 2018).
Recent publications raised the probable role of altered gut flora (dysbiosis) in the development of diabetes (T1D, T2D) alike. Antibiotics, might enter humans as therapeutic agents or as environmental pollutants which are capable of inducing profound changes in the microbiome and they have the potential capability to trigger diabetes-related dysbiosis (Siljander H, et al., 2019; Hu Y, et al., 2017; Yuan J, et al., 2020; Mikkelsen KH, et al., 2015). In one of our previous studies (Ternák G, et al., 2021) we have observed the inverse association between the prevalence of T1D and the utilization of broad-spectrum, beta-lactamase resistant, combination penicillin (J01CR) in European countries, while the outstanding utilization of narrow-spectrum penicillin (J01CE, CF), particularly in Scandinavian countries, showed correlation with the higher prevalence of T1D.
Our present work intended to confirm the above association by using a slightly modified antibiotic consumption database, and we wanted to elucidate the probable role of different antibiotic classes in the development of T1D and T2D as well.
Based on the above observations, we have hypothesized that different classes of antibiotics inducing different dysbiosis might influence the development of diabetes (T1D, T2D). The altered microbiome might generate diverse mediator molecules, which could act as enhancers or inhibitors, through different mechanisms, in addition to other factors, in the process of developing diabetes. It was suspected that if such association exists, the antibiotic consumption patterns might influence the prevalence of diabetes (T1D, T2D) in different countries.
Materials and Methods
The average yearly antibiotic consumption 2010-19 was calculated for 30 European countries published in ECDC (European Centre for Disease Prevention and Control) databases (ECDC, 2020) and expressed in Defined Daily Dose/1000 inhabitants/Day (DID) at ATC (Anatomical Therapeutic Chemical Classification System) level three for the five major antibiotic classes, as tetracycline /J01A/, penicillin /J01C/, cephalosporin /J01D/, macrolides /J01F/, quinolones /J01M/). Subgroups of penicillin (J01C) were separately calculated at ATC level four, for narrow-spectrum beta-lactamase sensitive penicillin (J01CE), beta-lactamase resistant narrow-spectrum penicillin (J01CF), broad-spectrum beta-lactamase sensitive penicillin (J01CA), and broad-spectrum penicillin combined with a beta-lactamase inhibitor (J01CR) as appeared in the ECDC database.
Data of the average yearly antibiotic consumption of the five major antibiotic classes (ATC level three) and the penicillin subgroups have been estimated as a relative average share in percent (%) of the total amount of the systemic antibiotic consumption (J01, in DID as 100%) in the European countries included (30 countries) in the study.
Diabetes prevalence data for comparison have been extracted from the Diabetes Atlas for 2019 (IDF, 2019).
Prevalence of T1D of 0-19 years was calculated for 100000 inhabitants/ country. As for adult diabetes, the figures of age-adjusted (20-79 years) prevalence has been similarly calculated and used for comparison.
The rank order of countries (reducing) starting with the highest prevalence of T1D and T2D (first ten positions) was compared to the rank orders of the utilization of different antibiotic classes for estimating possible concordance or discordance between countries with higher consumption of “enhancer” antibiotic classes or low consumption of “inhibitor” type of antibiotic classes.
Statistics
Pearson correlations were used to calculate the possible significance, between antibiotic consumption data of major antibiotic classes and the prevalence of T1D and T2D. Positive, significance was estimated if correlation (r) was a positive number and p-value was ≤ 0,05, and considered as positive, “enhancer” association. Negative significance was estimated when correlation (r) was a negative number and the related p was ≤ 0,05. This result was counted as a negative, non-supportive, “inhibitor” association.
Variance analyses (ANOVA) were applied to estimate the association (concordance) between the consumption of “enhancer" and "inhibitor" types of antibiotics and countries with the top highest prevalence of T1D, and T2D.
Datasheets and diagrams were developed to present the positive or negative associations (Tables 1-3 and Figures 1-7) between the consumption of certain antibiotic types and the prevalence of T1D and T2D in the European countries featured in the study.
| Average antibiotic consumption for 2010-19 | Total systemic antibiotic consumption in DID J01 |
J01A % |
J01C % |
J01CA % |
J01CE% | J01CF% | J01CR% | J01D% | J01F% | J01M% | People with diabetes, 100000 population/ | Type 1 diabetes (0-19 y),/100000 population/ country |
|---|---|---|---|---|---|---|---|---|---|---|---|---|
| Austria | 12 | 7,41 | 39,91 | 6,58 | 6,58 | 0,08 | 26,75 | 12,91 | 24,83 | 10,16 | 7214,85 | 33,74 |
| Belgium | 22,25 | 9,07 | 46,42 | 22,2 | 0,13 | 1,16 | 22,92 | 6,29 | 15,28 | 10,02 | 4887,57 | 35,71 |
| Bulgaria | 17,87 | 9,62 | 30,38 | 17,51 | 1,06 | 0 | 11,08 | 19,13 | 20,42 | 14,6 | 6275,16 | 15,6 |
| Croatia | 17,32 | 6,04 | 44,11 | 11,37 | 3,81 | 0 | 28,86 | 16,39 | 16,62 | 8,31 | 5078,91 | 31,28 |
| Cyprus | 26,64 | 12,68 | 34,3 | 9,12 | 0,3 | 0,07 | 24,84 | 20,53 | 10,96 | 17,83 | 7719,05 | 33,63 |
| Czechia | 16,64 | 12,68 | 35,81 | 6,97 | 11,17 | 0,3 | 17,3 | 11,17 | 22,05 | 5,7 | 7675,09 | 38,44 |
| Denmark | 15,1 | 10,79 | 63,64 | 21,12 | 28,34 | 9,2 | 4,9 | 0,19 | 12,64 | 3,17 | 6467,17 | 53,89 |
| Estonia | 10,25 | 15,41 | 32,29 | 16,78 | 1,85 | 0 | 13,65 | 10,73 | 23,02 | 8,09 | 4437,15 | 37,8 |
| Finland | 15,73 | 24,72 | 30,38 | 16,84 | 7,88 | 0,08 | 5,4 | 13,54 | 7,18 | 4,83 | 6767,06 | 130,21 |
| France | 23,54 | 13,55 | 52,54 | 31,18 | 0,72 | 1,06 | 19,75 | 8,62 | 13,89 | 6,92 | 5354,63 | 42,01 |
| Germany | 12,97 | 16,26 | 26,44 | 17,27 | 6,26 | 0,07 | 1,87 | 21,74 | 17,88 | 9,63 | 11441,28 | 39,82 |
| Greece | 31,19 | 7,98 | 30,65 | 14,17 | 0,25 | 0 | 16,25 | 24,39 | 24,04 | 8,43 | 5834,31 | 29,46 |
| Hungary | 13,62 | 8,66 | 33,99 | 6,46 | 1,9 | 0 | 25,62 | 13,95 | 21,51 | 16,29 | 7051,25 | 36,05 |
| Iceland | 19,03 | 25,27 | 47,45 | 16,97 | 10,93 | 5,45 | 14,13 | 3,04 | 8,46 | 4,78 | 5405,2 | 29,7 |
| Ireland | 19,83 | 14,46 | 48,21 | 14,92 | 5,34 | 7,06 | 20,92 | 5,95 | 20,77 | 4,18 | 3075,52 | 68,48 |
| Italy | 21,7 | 2,48 | 45,94 | 12,02 | 0 | 0,04 | 33,87 | 10,69 | 20,69 | 14,42 | 6052,39 | 26,39 |
| Latvia | 11,14 | 20,46 | 38,5 | 25,94 | 0,44 | 0 | 12,11 | 4,8 | 15,43 | 8,88 | 5408,46 | 15,56 |
| Lithuania | 13,9 | 10,57 | 46,97 | 35,25 | 1,65 | 0 | 10,14 | 8,63 | 14,31 | 6,83 | 4080,3 | 35,7 |
| Luxembourg | 21,89 | 8,26 | 39,28 | 14,29 | 0,09 | 0,82 | 24,16 | 15,3 | 17,81 | 11,42 | 4733,18 | 33,1 |
| Malta | 19,26 | 6,9 | 33,28 | 2,54 | 0,51 | 0,31 | 29,95 | 22,01 | 20,35 | 11,94 | 6702,58 | 33,1 |
| Netherlands | 9,44 | 23,72 | 32,52 | 13,87 | 2,75 | 4,66 | 11,22 | 0,42 | 15,04 | 8,15 | 5973,78 | 42,79 |
| Norway | 15,16 | 19,59 | 39,77 | 13,98 | 21,56 | 4,1 | 0,12 | 0,59 | 9,36 | 2,96 | 5477,75 | 71,19 |
| Poland | 20,9 | 11 | 31,86 | 16,36 | 1,14 | 0,04 | 14,25 | 13,49 | 20 | 6,31 | 6182,76 | 33,23 |
| Portugal | 17,65 | 4,87 | 47,81 | 9,63 | 0,11 | 3 | 35,07 | 9 | 16,94 | 12,12 | 10628,7 | 24,38 |
| Romania | 25,76 | 4,19 | 47,47 | 17,97 | 3,1 | 2,52 | 23,83 | 30,59 | 11,29 | 12,92 | 6553,33 | 14,35 |
| Slovakia | 19,92 | 8,08 | 29,41 | 5,02 | 6,07 | 0 | 18,32 | 22,99 | 26,6 | 9,73 | 6922,78 | 25,67 |
| Slovenia | 11,72 | 3,49 | 59,47 | 19,36 | 14,33 | 1,42 | 24,4 | 2,81 | 15,35 | 9,38 | 5895,55 | 28,88 |
| Spain | 19,78 | 5,2 | 55,3 | 21,94 | 0,45 | 1,06 | 31,95 | 9,4 | 12,28 | 12,79 | 7750,86 | 33,2 |
| Sweden | 12,25 | 22,36 | 50,44 | 8,73 | 27,59 | 12,2 | 1,79 | 1,14 | 4,81 | 5,55 | 5226,82 | 86,24 |
| UK | 17,18 | 27,35 | 38,12 | 20,43 | 4,77 | 8,38 | 4,54 | 1,86 | 17,05 | 2,61 | 3992,3 | 58,24 |
| Pearson T1D R |
-0,226 | 0,58* | -0,008 | -0,014 | 0,488* | 0,43* | -0,519** | -0,349** | -0,473** | -0,558** | - | - |
| Pearson T1D P |
0,251 | 0,001* | 0,968 | 0,94 | 0,006* | 0,018* | 0,003** | 0,059** | 0,008** | 0,001** | ||
| Pearson T1D R |
-0,027 | -0,242 | -0,212 | -0,339** | -0,051 | -0,277 | 0,167 | 0,364* | 0,065 | 0,41* | ||
| Pearson T1D P |
0,886 | 0,198 | 0,261 | 0,067** | 0,79 | 0,138 | 0,377 | 0,048* | 0,703 | 0,025 |
Note: * is positive significance and ** is negative significance Where J01: Antibiotics for systemic use; J01A: Tetracycline; J01C: Penicillin; J01CA: Brad-spectrum, beta-lactamase sensitive penicillin; J01CE: Narrow-spectrum, beta lactamase-sensitive penicillin; J01CE: Narrow-spectrum, beta-lactamase resistant penicillin; J01CR: Broad-spectrum beta-lactamase resistant, combination penicillin; J01D: Cephalosporin; J01F: Macrolides, J01M: Quinolone
Table 1: Average, yearly antibiotic consumption 2010-19 estimated as relative share in percentage (%) of the total consumption of systemic antibiotics (J01) expressed as Defined Daily Dose/1000 Inhabitants/Day (DID) compared to the prevalence of T1D and T2D for 100000 population (2019).
| Countries | T1D | Countries | J01A | Countries | J01CE | Countries | J01CR | Countries | J01M |
|---|---|---|---|---|---|---|---|---|---|
| Finland | 130,21 | UK | 27,35 | Denmark | 28,34 | Portugal | 35,07 | Cyprus | 17,83 |
| Sweden | 86,24 | Iceland | 25,27 | Sweden | 27,59 | Italy | 33,87 | Hungary | 16,29 |
| Norway | 71,19 | Finland | 24,72 | Norway | 21,56 | Spain | 31,95 | Bulgaria | 14,6 |
| Ireland | 68,48 | Netherlands | 23,72 | Slovenia | 14,33 | Malta | 29,95 | Italy | 14,42 |
| UK | 58,24 | Sweden | 22,36 | Czechia | 11,17 | Croatia | 28,86 | Romania | 12,92 |
| Denmark | 53,89 | Latvia | 20,46 | Iceland | 10,93 | Austria | 26,75 | Spain | 12,79 |
| Netherlands | 42,79 | Norway | 19,59 | Finland | 7,88 | Hungary | 25,62 | Portugal | 12,12 |
| France | 42,01 | Germany | 16,26 | Austria | 6,58 | Cyprus | 24,84 | Malta | 11,94 |
| Germany | 39,82 | Estonia | 15,41 | Germany | 6,26 | Slovenia | 24,4 | Luxembourg | 11,42 |
| Czechia | 38,44 | Ireland | 14,46 | Slovakia | 6,07 | Luxembourg | 24,16 | Austria | 10,16 |
| Estonia | 37,8 | France | 13,55 | Ireland | 5,34 | Romania | 23,83 | Belgium | 10,02 |
| Hungary | 36,05 | Cyprus | 12,68 | UK | 4,77 | Belgium | 22,92 | Slovakia | 9,73 |
| Belgium | 35,71 | Czechia | 12,68 | Croatia | 3,81 | Ireland | 20,92 | Germany | 9,63 |
| Lithuania | 35,7 | Poland | 11 | Romania | 3,1 | France | 19,75 | Slovenia | 9,38 |
| Austria | 33,74 | Denmark | 10,79 | Netherlands | 2,75 | Slovakia | 18,32 | Latvia | 8,88 |
| Cyprus | 33,63 | Lithuania | 10,57 | Hungary | 1,9 | Czechia | 17,3 | Greece | 8,43 |
| Poland | 33,23 | Bulgaria | 9,62 | Estonia | 1,85 | Greece | 16,25 | Croatia | 8,31 |
| Spain | 33,2 | Belgium | 9,07 | Lithuania | 1,65 | Poland | 14,25 | Netherlands | 8,15 |
| Luxembourg | 33,1 | Hungary | 8,66 | Poland | 1,14 | Iceland | 14,13 | Estonia | 8,09 |
| Malta | 33,1 | Luxembourg | 8,26 | Bulgaria | 1,06 | Estonia | 13,65 | France | 6,92 |
| Croatia | 31,28 | Slovakia | 8,08 | France | 0,72 | Latvia | 12,11 | Lithuania | 6,83 |
| Iceland | 29,7 | Greece | 7,98 | Malta | 0,51 | Netherlands | 11,22 | Poland | 6,31 |
| Greece | 29,46 | Austria | 7,41 | Spain | 0,45 | Bulgaria | 11,08 | Czechia | 5,7 |
| Slovenia | 28,88 | Malta | 6,9 | Latvia | 0,44 | Lithuania | 10,14 | Sweden | 5,55 |
| Italy | 26,39 | Croatia | 6,04 | Cyprus | 0,3 | Finland | 5,4 | Finland | 4,83 |
| Slovakia | 25,67 | Spain | 5,2 | Greece | 0,25 | Denmark | 4,9 | Iceland | 4,78 |
| Portugal | 24,38 | Portugal | 4,87 | Belgium | 0,13 | UK | 4,54 | Ireland | 4,18 |
| Bulgaria | 15,6 | Romania | 4,19 | Portugal | 0,11 | Germany | 1,87 | Denmark | 3,17 |
| Latvia | 15,56 | Slovenia | 3,49 | Luxembourg | 0,09 | Sweden | 1,79 | Norway | 2,96 |
| Romania | 14,35 | Italy | 2,48 | Italy | 0 | Norway | 0,12 | UK | 2,61 |
Table 2: Variance analysis (ANOVA) of rank order of T1D (first 10 position, shaded) compared to the rank order of antibiotic consumption with possible “enhancing” (tetracycline: J01A, /p: 0.015/, narrow spectrum, beta-lactamase sensitive penicillin: J01CE /p: 0.008/) or “inhibiting” (broad-spectrum, beta-lactamase resistant, combination penicillin: J01CR /p: 0.005/, quinolone: J01M /p: 0.036/) effect on the prevalence of T1D.
| Countries | T2 DM | Countries | J01D | Countries | J01M | Countries | J01CA |
|---|---|---|---|---|---|---|---|
| Germany | 11441,28 | Romania | 30,59 | Cyprus | 17,83 | Lithuania | 35,25 |
| Portugal | 10628,7 | Greece | 24,39 | Hungary | 16,29 | France | 31,18 |
| Spain | 7750,86 | Slovakia | 22,99 | Bulgaria | 14,6 | Latvia | 25,94 |
| Cyprus | 7719,05 | Malta | 22,01 | Italy | 14,42 | Belgium | 22,2 |
| Czechia | 7675,09 | Germany | 21,74 | Romania | 12,92 | Spain | 21,94 |
| Austria | 7214,85 | Cyprus | 20,53 | Spain | 12,79 | Denmark | 21,12 |
| Hungary | 7051,25 | Bulgaria | 19,13 | Portugal | 12,12 | UK | 20,43 |
| Slovakia | 6922,78 | Croatia | 16,39 | Malta | 11,94 | Slovenia | 19,36 |
| Finland | 6767,06 | Luxembourg | 15,3 | Luxembourg | 11,42 | Romania | 17,97 |
| Malta | 6702,58 | Hungary | 13,95 | Austria | 10,16 | Bulgaria | 17,51 |
| Romania | 6553,33 | Finland | 13,54 | Belgium | 10,02 | Germany | 17,27 |
| Denmark | 6467,17 | Poland | 13,49 | Slovakia | 9,73 | Iceland | 16,97 |
| Bulgaria | 6275,16 | Austria | 12,91 | Germany | 9,63 | Finland | 16,84 |
| Poland | 6182,76 | Czechia | 11,17 | Slovenia | 9,38 | Estonia | 16,78 |
| Italy | 6052,39 | Estonia | 10,73 | Latvia | 8,88 | Poland | 16,36 |
| Netherlands | 5973,78 | Italy | 10,69 | Greece | 8,43 | Ireland | 14,92 |
| Slovenia | 5895,55 | Spain | 9,4 | Croatia | 8,31 | Luxembourg | 14,29 |
| Greece | 5834,31 | Portugal | 9 | Netherlands | 8,15 | Greece | 14,17 |
| Norway | 5477,75 | Lithuania | 8,63 | Estonia | 8,09 | Norway | 13,98 |
| Latvia | 5408,46 | France | 8,62 | France | 6,92 | Netherlands | 13,87 |
| Iceland | 5405,2 | Belgium | 6,29 | Lithuania | 6,83 | Italy | 12,02 |
| France | 5354,63 | Ireland | 5,95 | Poland | 6,31 | Croatia | 11,37 |
| Sweden | 5226,82 | Latvia | 4,8 | Czechia | 5,7 | Portugal | 9,63 |
| Croatia | 5078,91 | Iceland | 3,04 | Sweden | 5,55 | Cyprus | 9,12 |
| Belgium | 4887,57 | Slovenia | 2,81 | Finland | 4,83 | Sweden | 8,73 |
| Luxembourg | 4733,18 | UK | 1,86 | Iceland | 4,78 | Czechia | 6,97 |
| Estonia | 4437,15 | Sweden | 1,14 | Ireland | 4,18 | Austria | 6,58 |
| Lithuania | 4080,3 | Norway | 0,59 | Denmark | 3,17 | Hungary | 6,46 |
| UK | 3992,3 | Netherlands | 0,42 | Norway | 2,96 | Slovakia | 5,02 |
| Ireland | 3075,52 | Denmark | 0,19 | UK | 2,61 | Malta | 2,54 |
Table 3: Variance analysis (ANOVA) of the rank order of T2D (first 10 positions, shaded) compared to the rank order of antibiotic consumption with possible “enhancing” (cephalosporin: J01D, /p: 0.084/, quinolone: J01M, /p: 0.054/), or “inhibiting” (broad-spectrum, beta-lactamase sensitive penicillin: J01CA/p: 0.012/) effect on the prevalence of T1DT.
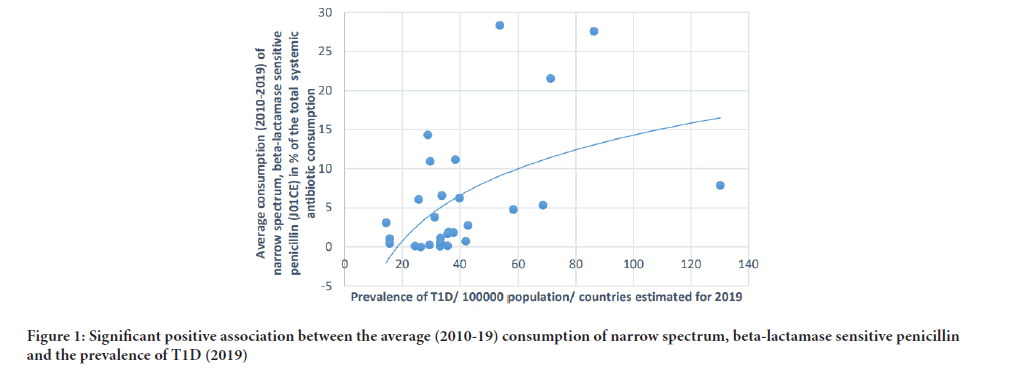
Figure 1: Significant positive association between the average (2010-19) consumption of narrow spectrum, beta-lactamase sensitive penicillin and the prevalence of T1D (2019)
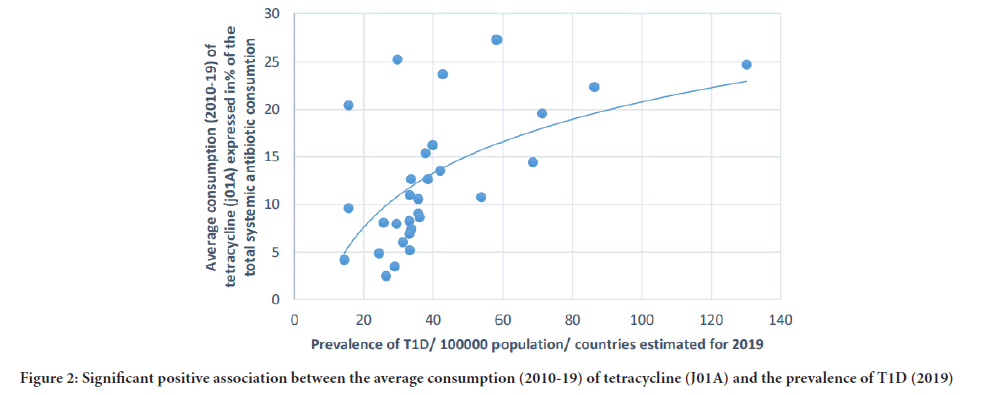
Figure 2: Significant positive association between the average consumption (2010-19) of tetracycline (J01A) and the prevalence of T1D (2019)
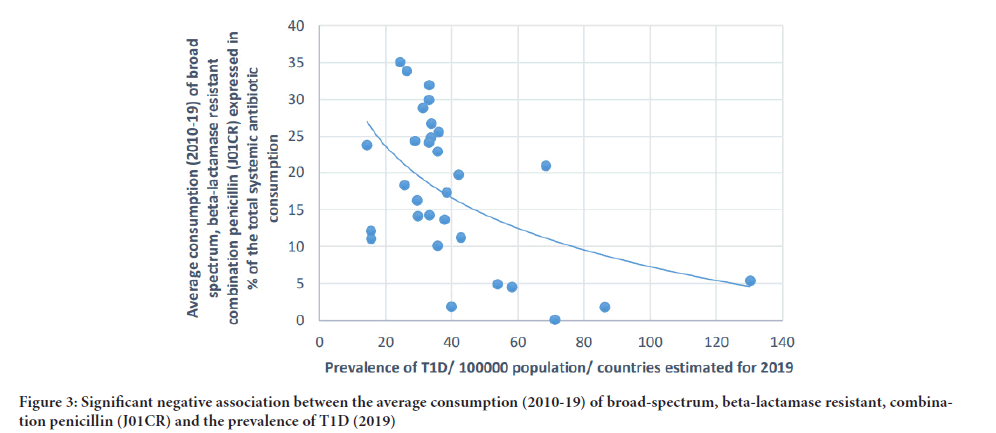
Figure 3:Significant negative association between the average consumption (2010-19) of broad-spectrum, beta-lactamase resistant, combination penicillin (J01CR) and the prevalence of T1D (2019)
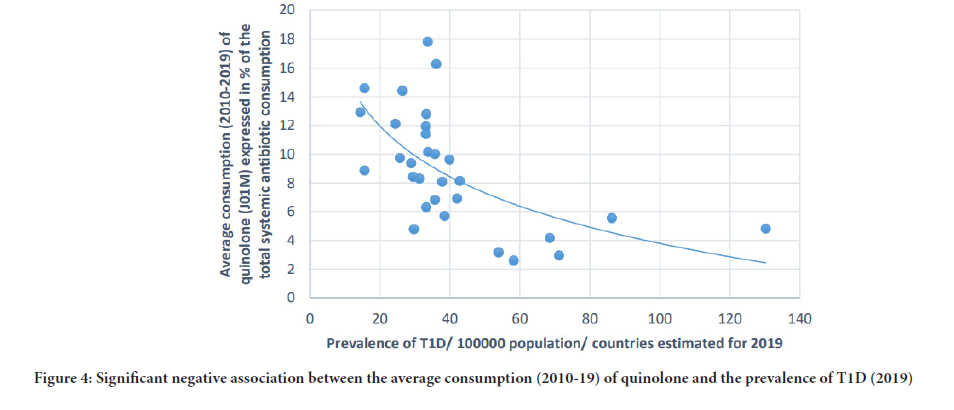
Figure 4:Significant negative association between the average consumption (2010-19) of quinolone and the prevalence of T1D (2019)
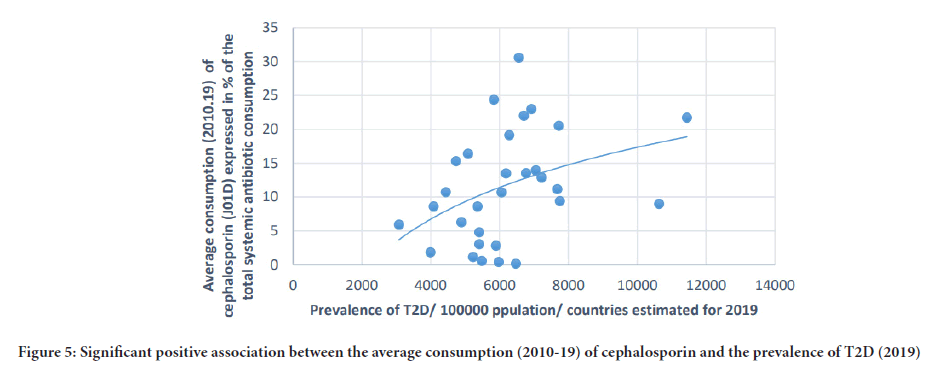
Figure 5: Significant positive association between the average consumption (2010-19) of cephalosporin and the prevalence of T2D (2019)
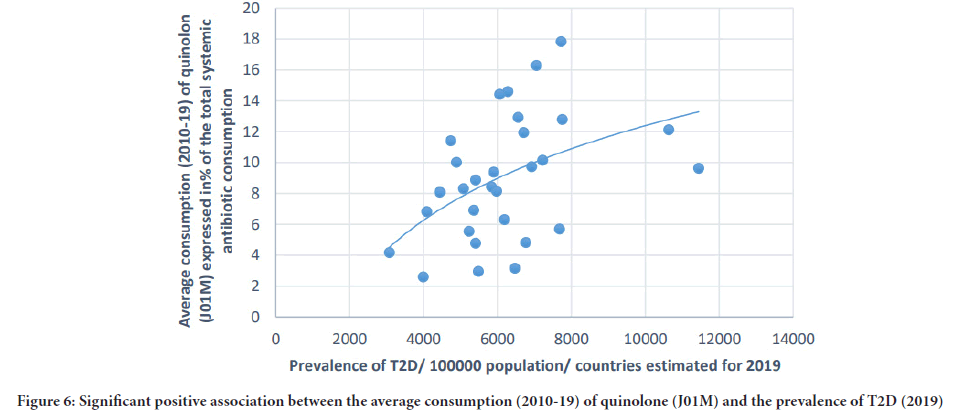
Figure 6: Significant positive association between the average consumption (2010-19) of quinolone (J01M) and the prevalence of T2D (2019)
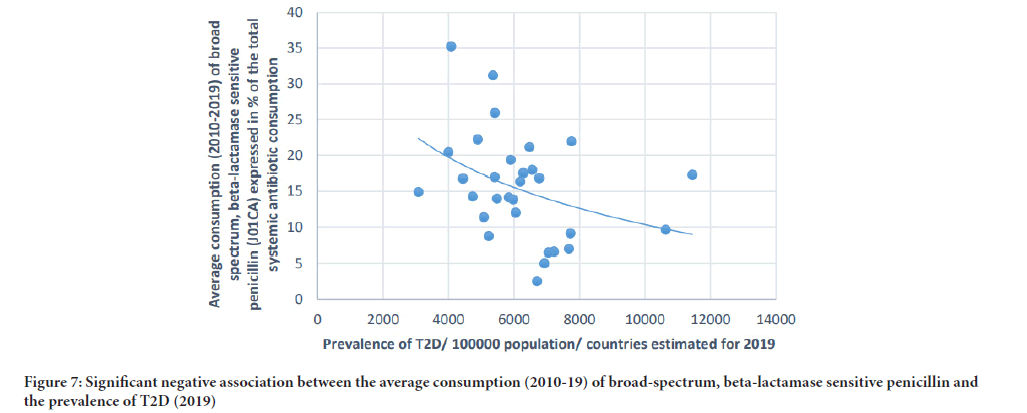
Figure 7: Significant negative association between the average consumption (2010-19) of broad-spectrum, beta-lactamase sensitive penicillin and the prevalence of T2D (2019)
Results
A positive, significant correlation has been estimated between tetracycline (J01A) consumption and the prevalence of T1D (where r=Pearson correlation coefficient) (Pearson r: 0.58, p: 0.001) similarly to the consumption of narrow spectrum, beta-lactamase sensitive penicillin (J01CE) (Pearson r: 0.488, p: 0.006), narrow spectrum, beta-lactamase resistant penicillin (J01CF) (Pearson r: 0.43, p: 0.018) and the prevalence of T1D. Inverse (negative) significant correlation was found between the prevalence of T1D and the utilization of broad-spectrum, beta-lactamase resistant combination penicillin (J01CR) (Pearson r: -0.519, p: 0.003), macrolides (J01F) (Pearson r:-0.473, p: 0.008), and quinolone (Pearson: r: -0.558, p: 0.001). A non-significant, negative correlation was recorded between cephalosporin consumption (J01D) and the prevalence of T1D (Pearson r: -0.349, p: 0.056) (Table 1, Figures 1-4).
The prevalence of T2D showed a positive, significant association with cephalosporin (Pearson r: 0.364, p: 0.048), and quinolone (Pearson r: 0.41, p: 0.025). A non-significant negative correlation was found between the prevalence of T2D and the consumption of broad-spectrum, beta-lactamase sensitive penicillin (J01CA) (Pearson r: -0,339, p: 0.067). (Table 1 and Figures 5-7).
Variance analysis (ANOVA) of rank order of T1D (first 10 position, Table 2, shaded) compared to the rank order of antibiotic consumption with possible “enhancing” (tetracycline: J01A, /p: 0.015/, narrow spectrum, beta-lactamase sensitive penicillin: J01CE /p: 0.008/) or “inhibiting” (broad-spectrum, beta-lactamase resistant, combination penicillin: J01CR /p: 0.005/, cephalosporin: J01D/p: 0.036/, quinolone: J01M/p: 0.003/) effect on the prevalence of T1D. The results indicated that countries with higher consumption of "enhancing" antibiotics, and the low consumption of "inhibiting" classes of antibiotics experience a higher prevalence of T1D.
A similar comparison of T2D prevalence (Table 3) showed that the higher consumption of "enhancing" type of antibiotics (cephalosporin, quinolone) and the low utilization of broad- spectrum, beta-lactamase sensitive penicillin (J01CA) with "inhibitor" effect, showed association with the higher prevalence rate of T2D.
Figures (1-7) feature the graphic appearance of positive and negative associations between the consumption of different antibiotic classes and the prevalence of T1D and T2D.
Discussion
Genetic analysis of type 1 diabetes (T1D) have found 50 susceptibility regions, and found major pathways increasing the risk of T1D, with some other loci shared across immune disorders. The identification of genetic factors are considered as major risks for the development of T1D, such as the T1D-associated single nucleotide polymorphisms (SNPs) in the Human Leukocyte Antigen (HLA) gene; and more specifically, the HLA-DQ, HLA-DR protein-coding genes HLA-DQA1 and HLA-DQB1 (Gumuscu OS, et al., 2015).
Researchers agree that the development of T1D cannot be explained only with the genetic background, but several external factors must be considered, including different infections, intestinal microbiota, vaccines, vitamin D3 deficiency, breastfeeding, dietary factors, etc. (Rewers M and Ludvigsson J, 2016; Dedrick S, et al., 2020).
Even the geographical location of a country (lassitude, longitude), cold climate, etc. was considered as causative factors. The dramatic increase of the T1D after World War II (WW II) contradicts all of such concepts because the geographical and meteorological conditions were the same before WW II, but the extensive discovery and utilization of antibiotics, beginning with penicillin, started only after WWII, and the outstanding use of penicillin is still observed recently in the Scandinavian countries along with the highest prevalence of T1D.
The most important diagnostic criteria for T1D is the elevated blood glucose levels (hyperglycemia), and the presence of autoantibodies, all of which occur/are present even before the development of β-cell destruction. Autoantibodies were observed against insulin (IAA), Glutamic Acid Decarboxylase (GADA), Insulinoma-Associated Autoantigen 2 (IA2A), and/or zinc transporter 8 (ZnT8A) and may occur many years before symptom onset (Lampasona V and Liberati D, 2016).
The appropriate composition and diversity is necessary for the development of normally functioning immune system. Several studies indicated that the gut microbial composition differs from healthy hosts and patients with T1D or at risk of T1D.
Animal experiments using Germ-Free (GF) and gnotobiotic mouse models demonstrated their important role in the alteration and differentiation of natural immune cell-types, particularly IL17 producing CD4+ T cells (Th17) and Foxp3+ T regulatory cells (Tregs) (Atarashi K, Honda K, 2011; Gensollen T, et al., 2016). It was observed that Segmented Filamentous Bacteria (SFB) are inducing the expression of pro- inflammatory Th17 cells, which play important role in maintaining the mucosal barrier and preventing NOD mice from developing type 1 diabetes (Kriegel MA, et al., 2011; Russell JT, et al., 2019). In another mouse models of autoimmune disease (e.g., K/BxN mouse model of autoimmune arthritis), SFB was shown to induce the disease progression through augmented Th17 accumulation, which suggests that their role in the development of autoimmunity is etiologically specific (Wu HJ, et al., 2010). The role of “protective” bacteria, like Lactobacilli, Bifidobacteria, and Clostridium species, are shown to be implicated in the induction of anti-inflammatory Treg cells. Other bacteria, as Bacteroides fragilis polysaccharide A (PSA) induces IL-10 production and it suppresses Th17 cell responses (Giacinto DC, et al., 2005; Atarashi K, et al., 2011). Experimental observations indicated a significant reduction in the abundance of Lactobacillus, Bryantella, Bifidobacterium, and Turicibacter in Bio-Breeding Diabetes-Prone (BB-DP) rats, while the number of Bacteroides, Eubacterium, and Ruminococcus increased in BB- DP rats compared with the Bio-Breeding Diabetes-Resistant (BB-DR) rats (Stewart CJ, et al., 2018; Kosiewicz MM, et al., 2011; Thomas S, et al., 2017; Han H, et al., 2018).
In pediatric diabetes, the abundance of Actinobacteria and Firmicutes, and the Firmicutes to Bacteroidetes ratio were significantly decreased, and the bacterial number of Bacteroidetes has significantly increased in healthy children. In diabetic children (T1D) a marked decrease of Lactobacillus and Bifidobacterium was observed, which showed association with higher blood glucose level (Murri M, et al., 2013; Kostic AD, et al., 2015; Vatanen T, et al., 2018; Rewers M, et al., 2018).
Large number of publications provided evidence for the possible role of gut microbiota in metabolic diseases including T2D. Major meta-analysis of the relevant literature indicated the association of T2D and some specific taxa of the microbiome (Gurung M, et al., 2020). It has been consistently reported that the genera of Bifidobacterium, Bacteroides, Faecalibacterium, Akkermansia, and Roseburia were reduced in T2D, while the abundance of Ruminococcus, Fusobacterium, and Blautia markedly increased in T2D. High level of intestinal permeability was observed in T2D as well, which facilitates the translocation of bacterial products in the blood, and it results metabolic endotoxemia (Aw W and Fukuda S, 2018).
The alteration of gut flora is frequently associated with metabolic disorders, like diabetes mellitus, insulin resistance, obesity and T2D. Low grade inflammation with elevated IL6 was observed in the presence of certain Gram-negative bacteria, like P.copri and B. vulgatus also. (Leite AZ, et al., 2017).
The role of dysbiosis in the occurrence of T1D and T2D is widely discussed and documented in the relevant scientific literature (referred above). We have detected that different antibiotic consumption patterns in European countries sowed strong (positive/negative) statistical correlations with the prevalence of T1D and T2D probably through the modification of the gut microbiome. It was observed that countries (mostly Scandinavian) with higher consumption of T1D "enhancing" antibiotics, like tetracycline (J01A) and narrow-spectrum penicillin (J01CE, J01CF) experience a higher prevalence of T1D, along with the low consumption of "inhibitors" antibiotics, like broad-spectrum, beta-lactamase resistant, combination penicillin (J01CR) and other broad-spectrum antibiotics (macrolides, quinolone).
According to our previous observations, we have found it interesting to learn that the higher consumption of the same antibiotics (tetracycline, narrow-spectrum penicillin) has shown an "enhancer" relationship with seemingly unrelated diseases. The higher incidence of some major carcinomas was observed in countries with higher consumption of tetracycline and narrow- spectrum penicillin also (Ternák G, et al., 2020). The phenomenon that patients with multiple sclerosis have a 3-5 fold higher chance to develop T1D had been documented in the literature (Nielsen NM, et al., 2006; Lorefice L, et al., 2018; Marrosu MG, et al., 2004).
We have observed before that the same antibiotics (tetracycline, narrow-spectrum penicillin) showed a positive, significant correlation with the prevalence of multiple sclerosis also (Ternák G, et al., 2020).
Conclusion
Based on the statistical comparison of large, publicly available databases of antibiotic consumption and the prevalence of T1D, T2D in thirty European countries, we have found convincing statistical associations between the prevalence of T1D, T2D, and the usage of different antibiotic classes, exhibit "enhancer" and "inhibitor" potency on the prevalence of diabetes. Countries' rank order with the first highest prevalence of T1D and T2D showed concordance with countries of the highest consumption of "enhancer" and the lowest consumption of "inhibitor" classes of antibiotics. It is suspected that different classes of antibiotics, producing different dysbiosis in the gut flora, changing the composition and the production of mediator molecules produced by different microbial taxa, play the part as enhancer or inhibitor factors in the development of T1D, and T2D, probably through the GBA, or other molecular mechanisms. Our findings might initiate further researches in these associations, which might identify new molecules (drugs) to reduce the occurrence of diabetes.
Limitations of the Study
The major limitations of our study is that the effects of antibiotics, outlined above, could not be proven at the individual level and it could not be interpreted as the direct effect of antibiotics, only as a possible triggering factor inducing dysbiosis, which might have enhanced or inhibiting effect on the development of diabetes through mediator molecules and GBA.
Strength of the Study
Comparing large databases provides an appropriate background for valid results. The statistical correlation (Pearson) is following the results of ANOVA analysis.
Author Contribution
GT: Developing the concept, writing the manuscript, MN: Calculating statistics, designing tables, diagrams, MR: Collecting and evaluating the literature included in the study, LB: A critical review of the manuscript, corrections
References
- Lin X, Xu Y, Pan X, Xu J, Ding Y, Sun X, et al. Global, regional, and national burden and trend of diabetes in 195 countries and territories: An analysis from 1990 to 2025. Sci Rep. 2020; 10(1): 14790.
[Crossref] [Google scholar] [Pubmed]
- Diabetes report 2000-2045. International Diabetes Federation (IDF). 2021.
- Global, regional, and national burden and trend of diabetes in 195 countries and territories: An analysis from 1990 to 2025
- Rewers M, Ludvigsson J. Environmental risk factors for T1DM. Lancet. 2016; 387: 2263-2350.
[Crossref] [Google scholar] [Pubmed]
- Dabelea D. The accelerating epidemic of childhood diabetes. Lancet. 2009; 373: 1999-2000.
[Crossref] [Google scholar] [Pubmed]
- Xie Z, Chang C, Huang G, Zhou Z. The role of epigenetics in Type 1 diabetes. Adv Exp Med Biol. 2020; 1253: 223-257.
- Atkinson MA, Eisenbarth GS, Michels AW. Type 1 diabetes. Lancet. 2014; 383(9911): 69-82.
[Crossref] [Google scholar] [Pubmed]
- Knip M, Luopajärvi K, Härkönen T. Early life origin of type 1 diabetes. Semin Immunopathol. 2017; 39(6): 653-667.
[Crossref] [Google scholar] [Pubmed]
- Sharma S, Tripathib P. Gut microbiome and T2DM: Where we are and where to go? J Nutr Biochem. 2019; 63: 101-108.
[Crossref] [Google scholar] [Pubmed]
- Barko PC, McMichael MA, Swanson KS, Williams DA. The gastrointestinal microbiome: A review. J Vet Intern Med. 2018; 32(1): 9-25.
[Crossref] [Google scholar] [Pubmed]
- Moghadam NF, Sedighi M, Khamseh ME, Alaei-Shahmiri F, Talebi M, Razavi S, et al. The association of type II diabetes with gut microbiota composition. Microb Pathog. 2017; 110: 630-636.
[Crossref] [Google scholar] [Pubmed]
- Zheng Y, Ley SH, Hu FB. Global aetiology and epidemiology of type 2 diabetes mellitus and its complications. Nat Rev Endocrinol. 2018; 14(2):88-98.
[Crossref] [Google scholar] [Pubmed]
- Siljander H, Honkanen J, Knip M. Microbiome and type 1 diabetes. EBioMedicine. 2019; 46: 512-521.
[Crossref] [Google scholar] [Pubmed]
- Hu Y, Wong FS, Wen L. Antibiotics, gut microbiota, environment in early life and type 1 diabetes. Pharmacol Res. 2017; 119: 219-226.
[Crossref] [Google scholar] [Pubmed]
- Yuan J, Hu YJ, Zheng J, Kim JH, Sumerlin T, Chen Y, et al. Long-term use of antibiotics and risk of type 2 diabetes in women: A prospective cohort study. Int J Epidemiol. 2020; 49(5): 1572-1581.
[Crossref] [Google scholar] [Pubmed]
- Mikkelsen KH, Knop FK, Frost M, Hallas J, Pottegård A. Use of antibiotics and risk of type 2 diabetes: A Population-based case-control study. J Clin Endocrinol Metab. 2015; 100(10): 3633-3640.
[Crossref] [Google scholar] [Pubmed]
- Ternák G, Berényi K, Kun S, Szigeti N, Decsi T, Suto G, et al. Inverse association between use of broad spectrum penicillin with beta-lactamase inhibitors and prevalence of type 1 diabetes mellitus in Europe. Sci Rep. 2021; 11(1): 16768.
- Quality indicators for antibiotic consumption in the community. European Centre for Disease Prevention and Control (ECDC). 2020.
- IDF diabetes atlas. International Diabetes Federation (IDF). 2019.
- Gumuscu OS, Chen WM, Burren O, Cooper NJ, Quinlan AR, Mychaleckyi JC, et al. Fine mapping of type 1 diabetes susceptibility loci and evidence for colocalization of causal variants with lymphoid gene enhancers. Nat Genet. 2015; 47(4): 381-386.
[Crossref] [Google scholar] [Pubmed]
- Dedrick S, Sundaresh B, Huang Q, Brady C, Yoo T, Cronin C, et al. The role of gut microbiota and environmental factors in type 1 diabetes pathogenesis. Front Endocrinol (Lausanne). 2020; 11: 78.
- Lampasona V, Liberati D. Islet autoantibodies. Curr Diab Rep. 2016; 16(6): 53.
[Crossref] [Google scholar] [Pubmed]
- Atarashi K, Honda K. Microbiota in autoimmunity and tolerance. Curr Opin Immunol. 2011; 23(6): 761-768.
[Crossref] [Google scholar] [Pubmed]
- Gensollen T, Iyer SS, Kasper DL, Blumberg RS. How colonization by microbiota in early life shapes the immune system. Science. 2016; 352: 539-544.
[Crossref] [Google scholar] [Pubmed]
- Kriegel MA, Sefik E, Hill JA, Wu HJ, Benoist C, Mathis D. Naturally transmitted segmented filamentous bacteria segregate with diabetes protection in nonobese diabetic mice. Proc Natl Acad Sci USA. 2011; 108(28): 11548-11553.
[Crossref] [Google scholar] [Pubmed]
- Russell JT, Roesch LFW, Ördberg M, Llonen J, Atkinson MA, Schatz DA, et al. Genetic risk for autoimmunity is associated with distinct changes in the human gut microbiome. Nat Commun. 2019; 10(1): 3621.
- Wu HJ, Ivanov II, Darce J, Hattori K, Shima T, Umesaki Y, et al. Gut-residing segmented filamentous bacteria drive autoimmune arthritis via T helper 17 cells. Immunity. 2010; 32(6): 815-27.
[Crossref] [Google scholar] [Pubmed]
- Giacinto DC, Marinaro M, Sanchez M, Strober W, Boirivant M. Probiotics ameliorate recurrent Th1-mediated murine colitis by inducing IL-10 and IL-10- dependent TGF-beta-bearing regulatory cells. J Immunol. 2005; 174(6): 3237-3246.
[Crossref] [Google scholar] [Pubmed]
- Atarashi K, Tanoue T, Shima T, Imaoka A, Kuwahara T, Momose Y, et al. Induction of colonic regulatory T cells by indigenous clostridium species. Science. 2011; 331: 337-341.
[Crossref] [Google scholar] [Pubmed]
- Stewart CJ, Ajami NJ, O'Brien JL, Hutchinson DS, Smith DP, Wong MC, et al. Temporal development of the gut microbiome in early childhood from the TEDDY study. Nature. 2018; 562(7728): 583-588.
- Kosiewicz MM, Zirnheld AL, Alard P. Gut microbiota, immunity, and disease: A complex relationship. Front Microbiol. 2011; 5(2): 180.
[Crossref] [Google scholar] [Pubmed]
- Thomas S, Izard J, Walsh E, Batich K, Chongsathidkiet P, Clarke G, et al. The host microbiome regulates and maintains human health: A primer and perspective for non-microbiologists. Cancer Res. 2017; 77(8): 1783-1812.
[Crossref] [Google scholar] [Pubmed]
- Han H, Li Y, Fang J, Liu G, Yin J, Li T, et al. Gut microbiota and type 1 diabetes. Int J Mol Sci. 2018; 19(4): 995.
[Crossref] [Google scholar] [Pubmed]
- Murri M, Leiva I, Gomez-Zumaquero JM, Tinahones FJ, Cardona F, Soriguer F, et al. Gut microbiota in children with type 1 diabetes differs from that in healthy children: A case-control study. BMC Med. 2013; 11(1): 1-2.
[Crossref] [Google scholar] [Pubmed]
- Kostic AD, Gevers D, Siljander H, Vatanen T, Hyotylainen T, Hamalainen AM, et al. The dynamics of the human infant gut microbiome in development and in progression toward type 1 diabetes. Cell Host Microbe. 2015; 17(2): 260-273.
[Crossref] [Google scholar] [Pubmed]
- Vatanen T, Franzosa EA, Schwager R, Tripathi S, Arthur TD, Vehik K, et al. The human gut microbiome in early onset type 1 diabetes from the TEDDY study. Nature. 2018; 562(7728): 589-594.
- Rewers M, Hyöty H, Lernmark Å, Hagopian W, She JX, Schatz D, et al. The Environmental Determinants of Diabetes in the Young (TEDDY) study: 2018 update. Curr Diab Rep. 2018; 18(12): 136.
[Crossref] [Google scholar] [Pubmed]
- Gurung M, Li Z, You H, Rodrigues R, Jump DB, Morgun A, et al. Role of gut microbiota in type 2 diabetes pathophysiology. EBioMedicine. 2020; 51: 102590.
[Crossref] [Google scholar] [Pubmed]
- Aw W, Fukuda S. Understanding the role of the gut ecosystem in diabetes mellitus. J Diabetes Investig. 2018; 9(1): 5-12.
[Crossref] [Google scholar] [Pubmed]
- Leite AZ, Rodrigues NC, Gonzaga MI, Piaolo JCC, de Souza CA, Stefanutto NAV, et al. Detection of increased plasma interleukin-6 levels and prevalence of Prevotella copri and Bacteroides vulgatus in the feces of type 2 diabetes patients. Front Immunol. 2017; 8: 1107.
[Crossref] [Google scholar] [Pubmed]
- Ternák G, Berényi K, Sümegi A, Szenczi A, Fodor B, Nemeth B, et al. Antibiotic consumption patterns in European countries may be associated with the incidence of major carcinomas. Antibiotics (Basel). 2020; 9(10): 643.
[Crossref] [Google scholar] [Pubmed]
- Nielsen NM, Westergaard T, Frisch M, Rostgaard K, Wohlfahrt J, Henriksen NK, et al. Type 1 diabetes and multiple sclerosis: A Danish population-based cohort study. Arch Neurol. 2006; 63(7): 1001-1004.
[Crossref] [Google scholar] [Pubmed]
- Lorefice L, Fenu G, Pitzalis R, Scalas G, Frau J, Coghe G, et al. Autoimmune comorbidities in multiple sclerosis: What is the influence on brain volumes? A case-control MRI study. J Neurol. 2018; 265(5): 1096-1101.
[Crossref] [Google scholar] [Pubmed]
- Marrosu MG, Motzo C, Murru R, Lampis R, Costa G, Zavattari P, et al. The co-inheritance of type 1 diabetes and multiple sclerosis in Sardinia cannot be explained by genotype variation in the HLA region alone. Hum Mol Genet. 2004; 13(23): 2919-2924.
[Crossref] [Google scholar] [Pubmed]
- Ternák G, Berényi K, Márovics G, Sumkegi A, Fodor B, Nemeth B, et al. Dominant antibiotic consumption patterns might be associated with the prevalence of multiple sclerosis in European countries. In vivo. 2020; 34(6): 3467-3472.
[Crossref] [Google scholar] [Pubmed]
Author Info
Gábor Ternák1*, Márton Németh2, Martin Rozanovic2 and Lajos Bogár22Department of Anesthesiology and Intensive Care, University of Pécs, Szigeti, Hungary
Citation: Ternák G: Antibiotic Consumption Patterns in European Countries Might Be Associated with the Prevalence of Diabetes Type-1-2 (T1D, T2D)
Received: 01-Apr-2022 Accepted: 29-Apr-2022 Published: 06-May-2022, DOI: 10.31858/0975-8453.13.5.306-315
Copyright: This is an open access article distributed under the terms of the Creative Commons Attribution License, which permits unrestricted use, distribution, and reproduction in any medium, provided the original work is properly cited.
ARTICLE TOOLS
- Dental Development between Assisted Reproductive Therapy (Art) and Natural Conceived Children: A Comparative Pilot Study Norzaiti Mohd Kenali, Naimah Hasanah Mohd Fathil, Norbasyirah Bohari, Ahmad Faisal Ismail, Roszaman Ramli SRP. 2020; 11(1): 01-06 » doi: 10.5530/srp.2020.1.01
- Psychometric properties of the World Health Organization Quality of life instrument, short form: Validity in the Vietnamese healthcare context Trung Quang Vo*, Bao Tran Thuy Tran, Ngan Thuy Nguyen, Tram ThiHuyen Nguyen, Thuy Phan Chung Tran SRP. 2020; 11(1): 14-22 » doi: 10.5530/srp.2019.1.3
- A Review of Pharmacoeconomics: the key to “Healthcare for All” Hasamnis AA, Patil SS, Shaik Imam, Narendiran K SRP. 2019; 10(1): s40-s42 » doi: 10.5530/srp.2019.1s.21
- Deuterium Depleted Water as an Adjuvant in Treatment of Cancer Anton Syroeshkin, Olga Levitskaya, Elena Uspenskaya, Tatiana Pleteneva, Daria Romaykina, Daria Ermakova SRP. 2019; 10(1): 112-117 » doi: 10.5530/srp.2019.1.19
- Dental Development between Assisted Reproductive Therapy (Art) and Natural Conceived Children: A Comparative Pilot Study Norzaiti Mohd Kenali, Naimah Hasanah Mohd Fathil, Norbasyirah Bohari, Ahmad Faisal Ismail, Roszaman Ramli SRP. 2020; 11(1): 01-06 » doi: 10.5530/srp.2020.1.01
- Manilkara zapota (L.) Royen Fruit Peel: A Phytochemical and Pharmacological Review Karle Pravin P, Dhawale Shashikant C SRP. 2019; 10(1): 11-14 » doi: 0.5530/srp.2019.1.2
- Pharmacognostic and Phytopharmacological Overview on Bombax ceiba Pankaj Haribhau Chaudhary, Mukund Ganeshrao Tawar SRP. 2019; 10(1): 20-25 » doi: 10.5530/srp.2019.1.4
- A Review of Pharmacoeconomics: the key to “Healthcare for All” Hasamnis AA, Patil SS, Shaik Imam, Narendiran K SRP. 2019; 10(1): s40-s42 » doi: 10.5530/srp.2019.1s.21
- A Prospective Review on Phyto-Pharmacological Aspects of Andrographis paniculata Govindraj Akilandeswari, Arumugam Vijaya Anand, Palanisamy Sampathkumar, Puthamohan Vinayaga Moorthi, Basavaraju Preethi SRP. 2019; 10(1): 15-19 » doi: 10.5530/srp.2019.1.3

