Research Article - (2022) Volume 13, Issue 3
Application of Statistical Tools-Mixture Optimal Designs on Optimization of Glipizide Controlled Release Tablets
Kunisetti Nagendra Babu* and A Deevan PaulAbstract
The principal aim of this paper is to apply the experimental design of experiments (mixture designs) to formulate a solid dosage form (glipizide controlled release tablets) using push pull osmotic drug delivery systems through the study of the excipients and their proportion in the formulation. The effect of different formulation variable namely, amount of Poly ethylene oxide in push and pull layers, amount of sodium chloride in push layer and effect of percentage weight gain of semi permeable membrane which influence the dissolution on 4 hrs, 8 hrs and 16 hrs was analysed. The design space obtained range between 156.943 mg-160.246 mg of Poly ethylene oxide (3 Lakh Molecular Weight (MW)), 84.5853 mg-84.8986 mg of Poly ethylene oxide (70 Lakh Molecular Weight) and 30.169 mg-32.1584 mg of Sodium chloride. All factors having significant effect on dissolution.
Keywords
Osmotic controlled drug delivery systems, Push pull drug delivery systems, Design of experiments, I-optimal mixture designs
Introduction
Osmotic controlled drug delivery systems is one and only systems for zero order drug release (Release rate is independent on concentration of the drug). This is having following advantages:
• Maintenance of constant blood levels within the therapeutic window
• Enhanced bioavailability
• Reduced inter patient variability
• Decreased dosing frequency
• Improved patient compliance
• Reduced side effects
Glipizide is used along with diet and exercise, and sometimes with other medications, to treat type 2 diabetes (condition in which the body does not use insulin normally and, therefore, cannot control the amount of sugar in the blood). Glipizide is in a class of medications called sulfonylureas (Khavare NB,et al., 2010). Glipizide lowers blood sugar by causing the pancreas to produce insulin (a natural substance that is needed to break down sugar in the body) and helping the body use insulin efficiently. This medication will only help lower blood sugar in people whose bodies produce insulin naturally. Glipizide is not used to treat type 1 diabetes (condition in which the body does not produce insulin and, therefore, cannot control the amount of sugar in the blood) or diabetic ketoacidosis (a serious condition that may occur if high blood sugar is not treated). Due to short biological half-life (2 hr-4 hr) of glipizide, it was easy to extend 24 hours in the body to maintain the glucose levels by using controlled release tablets (Gupta BP,et al., 2010).
The mixture design is the most suitable method used in optimizing the tablet production process. For example, in four components of formulation:
X1+X2+X3+X4=Total sum of variables
There are many types of mixture design: Simplex-lattice design, simplex-centroid design, axial design, and D/I-optimal design. I-optimality minimizes the average prediction variance of model over a region of measurement parameters, so it is more naturally applied when know the form of the model and want "good" prediction over design space. For this reason, I-optimality finds more use in a response surface optimization context. As compared with other designs, I-optimal design has a smaller number of runs and thus needs low cost of experimentation. So, based on this strategy these design selected for this study (Wen H and Park K, 2011) (Tables 1 and 2).
| Study Type | Design Type | Design Model | Subtype | Runs | Blocks |
|---|---|---|---|---|---|
| Mixture | I-optimal, Coordinate Exchange | Quadratic | Randomized | 12 | No Blocks |
Table 1: Design studied in optimisation of glipizide controlled release tablets
| Component | Name | Units | Type | Minimum | Maximum |
|---|---|---|---|---|---|
| A | PEO (MW 3 lakh) | Mg | Mixture | 145 | 175 |
| B | PEO (MW 70 lakhs) | Mg | Mixture | 80 | 90 |
| C | NaCl (Push layer) | Mg | Mixture | 20 | 40 |
| Total | 275 |
Note: PEO: Polyethylene oxide, MW: Molecular Weight
Table 2: Parameters studied in optimisation of glipizide controlled release tablets
Material and Methods
Materials
Glipizide taken from Orchid Health care, Poly ethylene oxide (PEO) (Grades-3 lakhs Molecular Weight, 50 lakhs Molecular Weight, 70 lakhs Molecular Weight, Opadry cellulose acetate and Opadry Pink taken from Dow and Colorcon respectively (Keraliya RA, et al., 2012). Microcrystalline cellulose (Avicel pH 101) used from Food Machinery and Chemical Corporation (FMC)/Signet Chemical Corporation Pvt Ltd. Magnesium stearate taken from Peter greven/S Zhaveri Pharmachem Pvt ltd. Iron oxide yellow taken from Sensient. NaCl, acetone and other analytical grades taken from Merk (Jamzad S and Fassihi R, 2006).
Methods
Preliminary study of screening the variables: From the literature the viscosity of the polyethylene oxide of low and high Molecular Weight was used in pull and push layer respectively (Verma RK and Garg S, 2004).
Initially, trails are started with low Molecular Weight polyethylene oxide (6 lakhs Molecular Weight) in pull layer and polyethylene oxide (70 lakhs Molecular Weight) for F1 Trail (Zhang Y, et al., 2003).
High Molecular Weight polyethylene oxide (3 lakhs Molecular Weight) in pull layer and polyethylene oxide (70 lakhs Molecular Weight) used for trial F2 (Tables 3 and 4).
| Pull layer (drug layer) | |||||||||||||||||||
|---|---|---|---|---|---|---|---|---|---|---|---|---|---|---|---|---|---|---|---|
| Ingredients | F1 | F2 | F3 | F4 | F5 | F6 | F7 | F8 | F9 | F10 | F11 | F12 | F13 | F14 | F15 | F16 | |||
| Glipizide | 10.00 | 10.00 | 10.00 | 10.00 | 10.00 | 10.00 | 10.00 | 10.00 | 10.00 | 10.00 | 10.00 | 10.00 | 10.00 | 10.00 | 10.00 | 10.00 | |||
| PEO (3L MW) |
160.00 (6L MW) |
160 | 160.00 | 150.525 | 156.944 | 154.059 | 154.059 | 168.43 | 145.00 | 168.43 | 162.503 | 171.381 | 171.381 | 156.944 | 156.944 | 160.00 | |||
| NaCl | 10.00 | 10.00 | 10.00 | 10.00 | 10.00 | 10.00 | 10.00 | 10.00 | 10.00 | 10.00 | 10.00 | 10.00 | 10.00 | 10.00 | 10.00 | 10.00 | |||
| Micro Crystalline Cellulose | 30.00 | 30.00 | 30.00 | 39.47 | 33.06 | 35.95 | 35.95 | 21.57 | 45.00 | 21.57 | 27.5 | 18.62 | 18.62 | 33.06 | 33.06 | 30.00 | |||
| Magnesium stearate | 1.00 | 1.00 | 1.00 | 1.00 | 1.00 | 1.00 | 1.00 | 1.00 | 1.00 | 1.00 | 1.00 | 1.00 | 1.00 | 1.00 | 1.00 | 1.00 | |||
| Total | 211.00 | 211.00 | 211.00 | 211.00 | 211.00 | 211.00 | 211.00 | 211.00 | 211.00 | 211.00 | 211.00 | 211.00 | 211.00 | 211.00 | 211.00 | 211.00 | |||
| Push layer | |||||||||||||||||||
| PEO (70L MW) |
85.00 | 90.00 | 85.00 | 90.00 | 85.8945 | 80.9407 | 80.9407 | 80.00 | 90.00 | 80.00 | 90.00 | 83.6188 | 83.6188 | 85.8945 | 85.8945 | 85.00 | |||
| NaCl | 30.00 | 34.475 | 30.00 | 34.475 | 32.1616 | 40.00 | 40.00 | 26.5702 | 40.00 | 26.5702 | 22.497 | 20.00 | 20.00 | 32.1616 | 32.1616 | 30.00 | |||
| Micro crystalline cellulose | 15.00 | 9.53 | 15.00 | 9.53 | 11.95 | 9.06 | 9.06 | 23.43 | 0.00 | 23.43 | 17.51 | 26.39 | 26.39 | 11.95 | 11.95 | 15.00 | |||
| Iron oxide Yellow | 1.00 | 1.00 | 1.00 | 1.00 | 1.00 | 1.00 | 1.00 | 1.00 | 1.00 | 1.00 | 1.00 | 1.00 | 1.00 | 1.00 | 1.00 | 1.00 | |||
| Magnesium stearate | 1.00 | 1.00 | 1.00 | 1.00 | 1.00 | 1.00 | 1.00 | 1.00 | 1.00 | 1.00 | 1.00 | 1.00 | 1.00 | 1.00 | 1.00 | 1.00 | |||
| Total | 132.00 | 132.00 | 132.00 | 132.00 | 132.00 | 132.00 | 132.00 | 132.00 | 132.00 | 132.00 | 132.00 | 132.00 | 132.00 | 132.00 | 132.00 | 132.00 | |||
| Semi permeable membrane (12%) | |||||||||||||||||||
| Opadry CA | 41 | 41 | 41 | 41 | 41 | 41 | 41 | 41 | 41 | 41 | 41 | 41 | 41 | 41 | 27 (8%) | 34 (10%) | |||
| Total | 384.00 | 384.00 | 384.00 | 384.00 | 384.00 | 384.00 | 384.00 | 384.00 | 384.00 | 384.00 | 384.00 | 384.00 | 384.00 | 384.00 | 370.00 | 377.00 | |||
| Colour coat (3.11%) | |||||||||||||||||||
| Opadry pink | 12.00 | 12.00 | 12.00 | 12.00 | 12.00 | 12.00 | 12.00 | 12.00 | 12.00 | 12.00 | 12.00 | 12.00 | 12.00 | 12.00 | 12.00 | 12.00 | |||
| Total | 396.00 | 396.00 | 396.00 | 396.00 | 396.00 | 396.00 | 396.00 | 396.00 | 396.00 | 396.00 | 396.00 | 396.00 | 396.00 | 396.00 | 382.00 | 389.00 | |||
Note: NaCl in pull layer, Magnesium stearate and iron oxide are constant and Micro Crystalline Cellulose (MCC) adjusted as per total weight
Table 3: Formulation trails of Glipizide controlled release tablets
| Time (hrs) | F1 | F2 |
|---|---|---|
| 0 | 0 | 0 |
| 1 | 0 | 0 |
| 2 | 2 | 1 |
| 4 | 13 | 10 |
| 8 | 30 | 32 |
| 16 | 48 | 70 |
| 20 | 58 | 77 |
| 24 | 62 | 80 |
Table 4: Percentage cumulative drug release of trails F1 and F2
Preparation of glipizide control release tablets using I-optimal mixture designs: Based on above trails Poly ethylene oxide (PEO) in both layers play a critical role along with Sodium chloride. So, these factors considered as Critical quality attributes (Thombre AG, et al., 2004).
Further, Polyethylene oxide (3 lakhs Molecular Weight) in pull layer, Polyethylene oxide (70 lakhs Molecular Weight) and Sodium chloride in Push layer was optimised using Mixture designs (Trails from F3-F14) (Table 5).
| Run | Component 1 | Component 2 | Component 3 | Response 1 | Response 2 | Response 3 |
|---|---|---|---|---|---|---|
| A:PEO (MW 3 lakh) | B:PEO (MW 70 lakhs) | Â C:NaCl (Push layer) | Dissolution 4 hrs | Dissolution 8 hrs | Dissolution 16 hrs | |
| Mg | Mg | Mg | % | % | % | |
| F3 | 160 | 85 | 30 | 10 | 32 | 73 |
| F4 | 150.525 | 90 | 34.475 | 12 | 30 | 71 |
| F5 | 156.944 | 85.8945 | 32.1616 | 10 | 30 | 70 |
| F6 | 154.059 | 80.9407 | 40 | 18 | 30 | 68 |
| F7 | 154.059 | 80.9407 | 40 | 19 | 31 | 66 |
| F8 | 168.43 | 80 | 26.5702 | 7 | 28 | 78 |
| F9 | 145 | 90 | 40 | 16 | 27 | 67 |
| F10 | 168.43 | 80 | 26.5702 | 8 | 29 | 76 |
| F11 | 162.503 | 90 | 22.4971 | 8 | 26 | 78 |
| F12 | 171.381 | 83.6188 | 20 | 6 | 20 | 95 |
| F13 | 171.381 | 83.6188 | 20 | 7 | 22 | 96 |
| F14 | 156.944 | 85.8945 | 32.1616 | 11 | 29 | 71 |
Table 5: Percentage cumulative drug release of trails F3-F14
I-optimal mixture design was used to determine the optimum amount of ingredients used in the formulation toward the responses, which is dissolution at 4 hours, 8 hours and 16 hours of the tablet. The statistical parameters used in evaluating and selecting the best-fitted model are coefficient of determination, adjusted coefficient of determination (adjusted), predicted coefficient of determination (predicted), Coefficient of Variation (CV), Standard Deviation (SD), Predicted Residual Sum of Squares (PRESS), lack-of-fit, and regression data (value and value) (Mangukia D, et al., 2012). The statistical analysis also constructs an equation from the best-fitted model. From the equation, the positivity of the coefficient presents the positive contribution toward the response, and vice versa. Also, a contour plot and three-dimensional response surface graph for each response were generated by Design-Expert Software (Tables 6 and 7).
| Response | Name | Units | Observations | Analysis | Minimum | Maximum | Mean | SD | Ratio | Transform | Model |
|---|---|---|---|---|---|---|---|---|---|---|---|
| R1 | Dissolution 4 hrs | % | 12 | Polynomial | 6 | 19 | 11.00 | 4.43 | 3.17 | None | Quadratic |
| R2 | Dissolution 8 hrs | % | 12 | Polynomial | 20 | 32 | 27.83 | 3.61 | 1.60 | None | Quadratic |
| R3 | Dissolution 16 hrs | % | 12 | Polynomial | 66 | 96 | 75.75 | 10.04 | 1.45 | None | Special Cubic |
Table 6: Response of formulation trails F3-F14
| Variables | A | B | C | AB | AC | BC | ABC |
|---|---|---|---|---|---|---|---|
| Dissolution 4 hr | 5.46759 | 13.233 | 33.1018 | 0.718639 | -23.2663 | -46.9172 | |
| p-values | <0.0001 | <0.0001 | <0.0001 | 0.9645 | 0.0009 | 0.0348 | |
| Dissolution 8 hrs | 20.5752 | 41.9614 | 20.8186 | -19.755 | 46.4674 | -4.71225 | |
| p-values | 0.0014 | 0.0014 | 0.0014 | 0.5394 | 0.0008 | 0.8938 | |
| Dissolution 16 hrs | 109.423 | 101.408 | 101.661 | -122.345 | -179.161 | -155.348 | 543.964 |
| p-values | <0.0001 | < 0.0001 | <0.0001 | 0.1131 | 0.0007 | 0.0745 | 0.0073 |
Table 7: Coefficients table
Formulation and development: Formulation development trails conducted based on the values of mixture design observing the product characteristics and performance parameters like dissolution profile (Lu EX, et al., 2003) (Table 3).
Manufacturing procedure: Based on drug substance flow properties (Poor) wet granulation technique adopted (Aulton ME and Taylor K, 2013) (Figure 1).
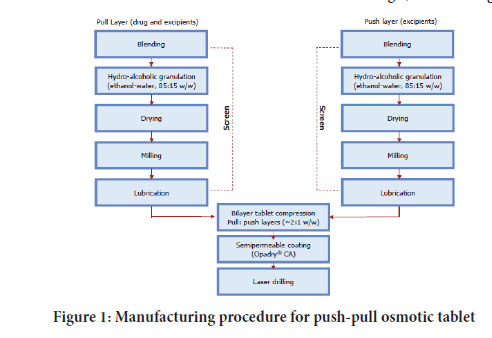
Figure 1: Manufacturing procedure for push-pull osmotic tablet
Based on design space, optimised trials of F5 and F14 was further selected for checking the effect of coating weight gain on drug release (Optimization of semi permeable membrane), F15, F16 trails performed for 8% and 10% weight gain respectively (Table 6).
Evaluation of Osmotic Tablets: These compression parameters are tested for uncoated and coated tablets: Assay, weight variation, hardness, friability, thickness, coating uniformity (for coated tablets), in vitro drug release studies (for coated tablets) (Jain NK, 2008).
These Pre-compression parameters are testes for optimised trails: Bulk density, tapped density, Carr’s index, Hausner’s Ratio, angle of repose and particle size distribution (Figures 2 and 3).

Figure 2: Side view of uncoated bi layered, Semi-permeable membrane coated, Top coated osmotic tablets
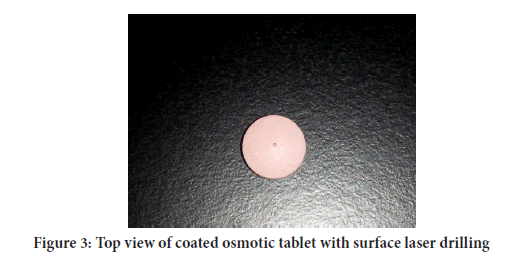
Figure 3: Top view of coated osmotic tablet with surface laser drilling
Results and Discussion
The following pre-compression parameters are obtained for trials F5 and F14:
1. Bulk density (g/mL): 0.42 for pull layer and 0.48 for push layer
2. Tapped density (g/mL): 0.54 for pull layer and 0.58 for push layer
3. Carr’s index (%): 22.2 for pull layer and 17.2 for push layer
4. Hausner’s ratio: 1.28 for pull layer and 1.20 for push layer
5. Flow character: Passable for pull layer and Fair for push layer
6. Angle of Repose: 32 for pull layer and 34 for push layer (Flow property is good)
7. Particle size distribution: #60 retention 22% for pull layer and 34% for push layer and base plate/fines 34% for push and pull layers.
The following Compression parameters are obtained for trials F1-F16:
1. Assay (95%-105%): All are trails are under mentioned range (97%-103%)
2. Average Weight (for 10 Tablets) of Uncoated bilayer tablet (3.43 g ± 3 g): All are trails are under mentioned range (3.41 g-3.46 g).
3. Individual Weight of Uncoated bilayer tablet (343 mg ± 5 mg): All are trails are under mentioned range (340 mg-348 mg).
Contour diagram and 3D diagram of relationship between three variables, A: Poly ethylene oxide (PEO) (3 Lakh Molecular Weight), B: Poly ethylene oxide (PEO) (70 Lakhs Molecular Weight), C: NaCl on Response: Dissolution in 4 hours, 8 hours and 16 hours are mentioned in graphical way (Figures 4-9) (Table 8).
| Time (hrs) | F15 | F16 |
|---|---|---|
| 0 | 0 | 0 |
| 1 | 6 | 2 |
| 2 | 9 | 4 |
| 4 | 30 | 22 |
| 8 | 62 | 56 |
| 16 | 100 | 100 |
| 20 | 100 | 100 |
| 24 | 100 | 100 |
Table 8: Percentage cumulative drug release of trails F15 and F16
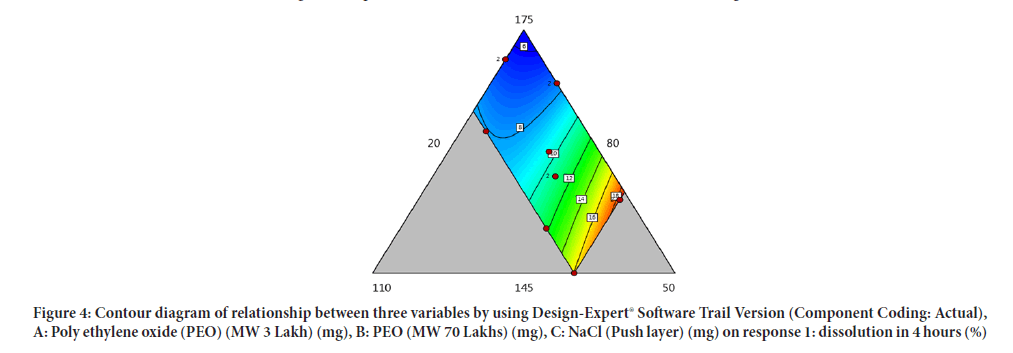
Figure 4: Contour diagram of relationship between three variables by using Design-Expert® Software Trail Version (Component Coding: Actual), A: Poly ethylene oxide (PEO) (MW 3 Lakh) (mg), B: PEO (MW 70 Lakhs) (mg), C: NaCl (Push layer) (mg) on response 1: dissolution in 4 hours (%)
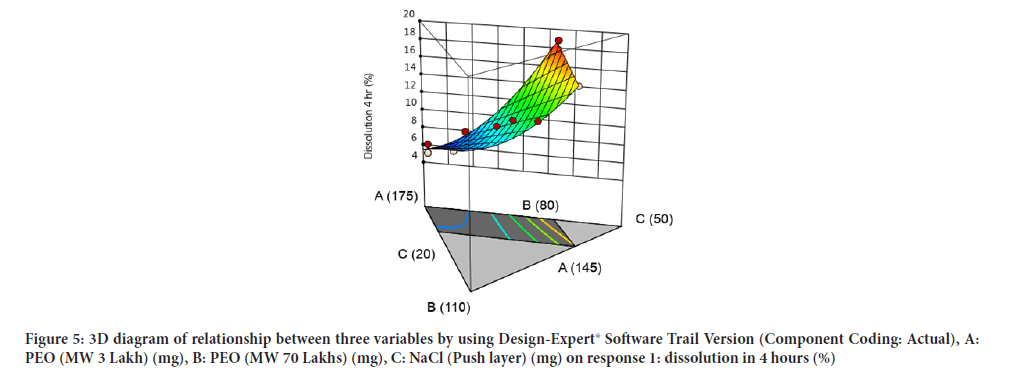
Figure 5:3D diagram of relationship between three variables by using Design-Expert® Software Trail Version (Component Coding: Actual), A: PEO (MW 3 Lakh) (mg), B: PEO (MW 70 Lakhs) (mg), C: NaCl (Push layer) (mg) on response 1: dissolution in 4 hours (%)X
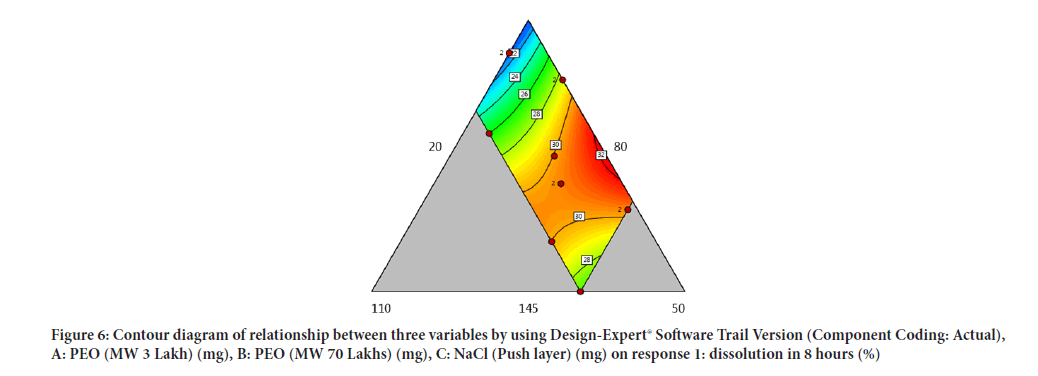
Figure 6: Contour diagram of relationship between three variables by using Design-Expert® Software Trail Version (Component Coding: Actual), A: PEO (MW 3 Lakh) (mg), B: PEO (MW 70 Lakhs) (mg), C: NaCl (Push layer) (mg) on response 1: dissolution in 8 hours (%)
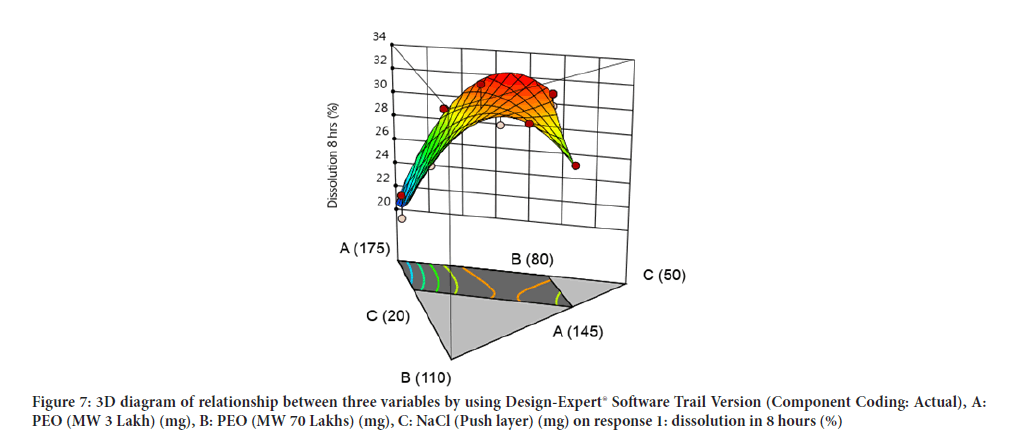
Figure 7: 3D diagram of relationship between three variables by using Design-Expert® Software Trail Version (Component Coding: Actual), A: PEO (MW 3 Lakh) (mg), B: PEO (MW 70 Lakhs) (mg), C: NaCl (Push layer) (mg) on response 1: dissolution in 8 hours (%)
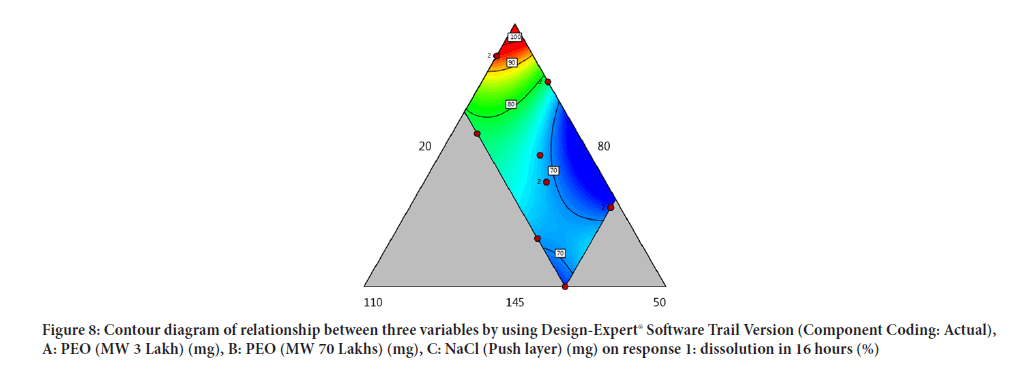
Figure 8: Contour diagram of relationship between three variables by using Design-Expert® Software Trail Version (Component Coding: Actual), A: PEO (MW 3 Lakh) (mg), B: PEO (MW 70 Lakhs) (mg), C: NaCl (Push layer) (mg) on response 1: dissolution in 16 hours (%)
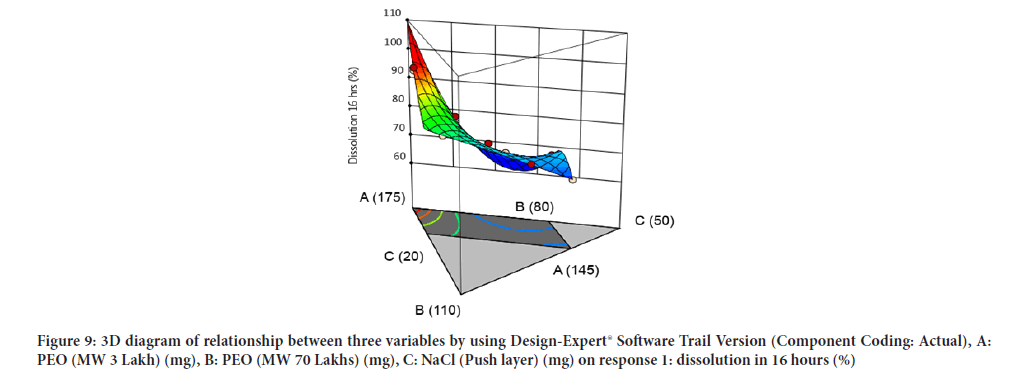
Figure 9: 3D diagram of relationship between three variables by using Design-Expert® Software Trail Version (Component Coding: Actual), A: PEO (MW 3 Lakh) (mg), B: PEO (MW 70 Lakhs) (mg), C: NaCl (Push layer) (mg) on response 1: dissolution in 16 hours (%)
Optimisation of factors and response using overlay plot and design space obtained range between 156.943 mg-160.246 mg of Poly ethylene oxide (3 Lakh Molecular Weight), 84.5853 mg-84.8986 mg of Poly ethylene oxide (70 Lakh Molecular Weight) and 30.169 mg-32.1584 mg of Sodium chloride (Figure 10).
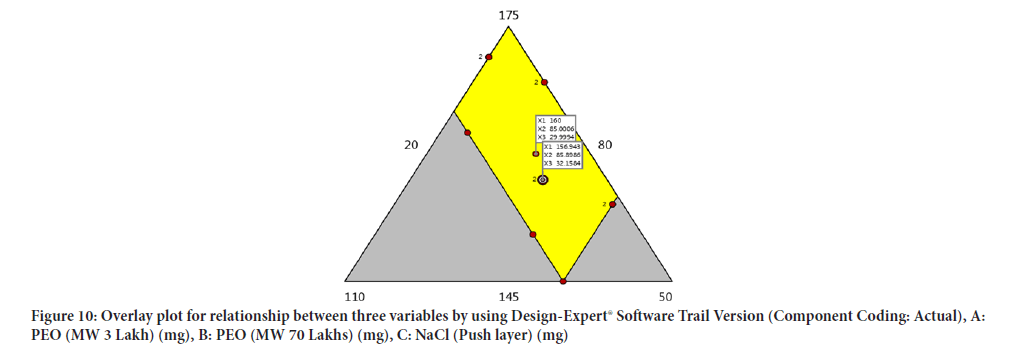
Figure 10: Overlay plot for relationship between three variables by using Design-Expert® Software Trail Version (Component Coding: Actual), A: PEO (MW 3 Lakh) (mg), B: PEO (MW 70 Lakhs) (mg), C: NaCl (Push layer) (mg)
F15 and F16 clearly indicated that the effect of % weight gain of semi permeable membrane on dissolution (Zen NIM, et al., 2015).
Conclusion
Dissolution at 4 hrs, 8 hrs and 16 hrs of Glipizide control release tablets evaluated by using different factors namely Poly ethylene oxide (PEO) 3 lakhs in pull layer and Poly ethylene oxide (PEO) 70 lakhs and NaCl using mixure designs. All factors shows significant effect on dissolution clearly mentioned in contour diagram and 3D diagrams as well as percentage weight gain of semi permeable membrane having significant effect on dissolution.
References
- Khavare NB, Dasankoppa FS, Najundaswamy NG. A review on key parameters and components in designing of osmotic controlled oral drug delivery systems. Indian J Nov Drug Deliv. 2010; 2(4): 122-131.
- Gupta BP, Thakur N, Jain NP, Banweer J, Jain S. Osmotically controlled drug delivery system with associated drugs. J Pharm Pharm Sci. 2010; 13(4): 571-588.
[Crossref] [Google Scholar] [Pubmed]
- Wen H, Park K. Oral controlled release formulation design and drug delivery: Theory to practice. John Wiley and Sons. 2011.
- Keraliya RA, Patel C, Patel P, Keraliya V, Soni TG, Patel RC, et al. Osmotic drug delivery system as a part of modified release dosage form. Int Sch Res Notices. 2012.
[Crossref] [Google Scholar] [Pubmed]
- Jamzad S, Fassihi R. Development of a controlled release low dose class II drug-Glipizide. Int J Pharm. 2006; 312(1-2): 24-32.
[Crossref] [Google Scholar] [Pubmed]
- Verma RK, Garg S. Development and evaluation of osmotically controlled oral drug delivery system of glipizide. Eur J Pharm Biopharm. 2004; 57(3): 513-525.
[Crossref] [Google Scholar] [Pubmed]
- Zhang Y, Zhang Z, Wu F. A novel pulsed-release system based on swelling and osmotic pumping mechanism. J Control Release. 2003; 89(1): 47-55.
[Crossref] [Google Scholar] [Pubmed]
- Thombre AG, Appel LE, Chidlaw MB, Daugherity PD, Dumont F, Evans LA, et al. Osmotic drug delivery using swellable-core technology. J Control Release. 2004; 94(1): 75-89.
[Crossref] [Google Scholar] [Pubmed]
- Mangukia D, Patel C, Patel J. Formulation and evaluation of self-pore forming osmotic tablet of glipizide. Int Res J Pharm. 2012; 3(4): 365-368.
- Lu EX, Jiang ZQ, Zhang QZ, Jiang XG. A water-insoluble drug monolithic osmotic tablet system utilizing gum arabic as an osmotic, suspending and expanding agent. J Controlled Release. 2003; 92(3): 375-382.
[Crossref] [Google Scholar] [Pubmed]
- Aulton ME, Taylor K. Aulton's pharmaceutics: The design and manufacture of medicines. Elsevier Health Sciences. 2013.
- Jain NK. Advances in controlled and novel drug delivery. CBS Publishers and Distributors. 2008.
- Zen NIM, Gani SSA, Shamsudin R, Masoumi HRF. The use of D-optimal mixture design in optimizing development of okara tablet formulation as a dietary supplement. The Sci World J. 2015.
[Crossref] [Google Scholar] [Pubmed]
Author Info
Kunisetti Nagendra Babu* and A Deevan PaulCitation: Babu KN: Application of Statistical Tools-Mixture Optimal Designs on Optimization of Glipizide Controlled Release Tablets
Received: 07-Feb-2022 Accepted: 22-Feb-2022 Published: 01-Mar-2022, DOI: 10.31858/0975-8453.13.3.188-195
Copyright: This is an open access article distributed under the terms of the Creative Commons Attribution License, which permits unrestricted use, distribution, and reproduction in any medium, provided the original work is properly cited.
ARTICLE TOOLS
- Dental Development between Assisted Reproductive Therapy (Art) and Natural Conceived Children: A Comparative Pilot Study Norzaiti Mohd Kenali, Naimah Hasanah Mohd Fathil, Norbasyirah Bohari, Ahmad Faisal Ismail, Roszaman Ramli SRP. 2020; 11(1): 01-06 » doi: 10.5530/srp.2020.1.01
- Psychometric properties of the World Health Organization Quality of life instrument, short form: Validity in the Vietnamese healthcare context Trung Quang Vo*, Bao Tran Thuy Tran, Ngan Thuy Nguyen, Tram ThiHuyen Nguyen, Thuy Phan Chung Tran SRP. 2020; 11(1): 14-22 » doi: 10.5530/srp.2019.1.3
- A Review of Pharmacoeconomics: the key to “Healthcare for All” Hasamnis AA, Patil SS, Shaik Imam, Narendiran K SRP. 2019; 10(1): s40-s42 » doi: 10.5530/srp.2019.1s.21
- Deuterium Depleted Water as an Adjuvant in Treatment of Cancer Anton Syroeshkin, Olga Levitskaya, Elena Uspenskaya, Tatiana Pleteneva, Daria Romaykina, Daria Ermakova SRP. 2019; 10(1): 112-117 » doi: 10.5530/srp.2019.1.19
- Dental Development between Assisted Reproductive Therapy (Art) and Natural Conceived Children: A Comparative Pilot Study Norzaiti Mohd Kenali, Naimah Hasanah Mohd Fathil, Norbasyirah Bohari, Ahmad Faisal Ismail, Roszaman Ramli SRP. 2020; 11(1): 01-06 » doi: 10.5530/srp.2020.1.01
- Manilkara zapota (L.) Royen Fruit Peel: A Phytochemical and Pharmacological Review Karle Pravin P, Dhawale Shashikant C SRP. 2019; 10(1): 11-14 » doi: 0.5530/srp.2019.1.2
- Pharmacognostic and Phytopharmacological Overview on Bombax ceiba Pankaj Haribhau Chaudhary, Mukund Ganeshrao Tawar SRP. 2019; 10(1): 20-25 » doi: 10.5530/srp.2019.1.4
- A Review of Pharmacoeconomics: the key to “Healthcare for All” Hasamnis AA, Patil SS, Shaik Imam, Narendiran K SRP. 2019; 10(1): s40-s42 » doi: 10.5530/srp.2019.1s.21
- A Prospective Review on Phyto-Pharmacological Aspects of Andrographis paniculata Govindraj Akilandeswari, Arumugam Vijaya Anand, Palanisamy Sampathkumar, Puthamohan Vinayaga Moorthi, Basavaraju Preethi SRP. 2019; 10(1): 15-19 » doi: 10.5530/srp.2019.1.3

