Research Article - (2024) Volume 15, Issue 5
Abstract
Objective: Multiple Sclerosis (MS) is the leading cause of acquired motor disability in young adults. The increase in disability follows the progression of the disease and imposes impact on the affected person, thereby causing a permanent multidimensional handicap. The identification of the factors associated with the evolution towards an irreversible handicap is important for an adequate therapeutic management. This study explored to identify non-modifiable factors associated with progression to irreversible disability in patients with MS.
Material and methods: This is a prospective collection study that was carried out in the physical medicine and rehabilitation departments of the University Hospital of Oran and the Regional Military University Hospital of Oran (HMRUO), between January 2017 and December 2019. For the main analysis, we retained an Expanded Disability Status Scale (EDSS) score, if the patient had same functional status during the last six months.
Results and discussion: This study included 103 MS cases, including 72 women and 31 men, with a mean age at onset of symptoms of 31.83 years and a mean EDSS of 5.12 ± 1.97.
The progression of the disability assessed by the EDSS scale is related to baseline characteristics such as gender, age at advanced onset and progressive form of MS. We did not find a correlation between the severity of the handicap and the place of birth and/or residence.
Our results are unanimous in the literature for certain parameters, and the same is not true for others.
Conclusion: Non-modifiable factors in MS, such as age, gender, place of birth and/or residence are important predictors of disability and should alert the clinician to appropriate and specific management even at an early stage of the disease.
Keywords
Multiple sclerosis, disability, assessment, EDSS
Introduction
Multiple Sclerosis (MS) is a chronic incurable disease of the central nervous system, combining an autoimmune inflammatory component and a neurodegenerative component. The respective proportions of these two components account for the particularities of the disease’s evolution, with a variable combination of more or less resolving relapses and progressive worsening of disability. MS affects over 2.8 million people worldwide. Its epidemiology is dominated by a north-south gradient in the northern hemisphere, and a south-north gradient in the southern hemisphere (Pauline MA, 2013; Martin JE, et al., 2016). On average, the onset of the disease occurs at the age of 30, at a crucial time in a person’s personal, professional and social life. It is the leading cause of non-traumatic disability among young people in many developed countries. Despite undeniable therapeutic advances, nothing can yet prevent the progression of the disease towards progressive and inexorable disability. Identifying the factors associated with progression to irreversible disability is an important step towards appropriate management.
Materials and Methods
General information
This is a descriptive, prospective, bicentric study of MS patients, which was carried out in the Physical Medicine and Rehabilitation Departments Of The University Hospital Centre Of Oran (CHUO) and Regional Military University Hospital of Oran (HMRUO) and the study population included all the MS patients referred to our level for rehabilitative care. This study was conducted for 2 years and 6 months (from January 2017 to June 2019).
Inclusion criteria
Patients with definite MS; patients who were diagnosed according to the Mac Donald 2005/2010 criteria and patients of age 18 or older were included in the study.
Exclusion criteria
Similarly, patients who were diagnosed with the disease within the last 6 months; patients having mental and cognitive disability/ with low comprehensibility; patients with the presence of severe psychiatric pathology, inflammatory, infectious or cardiac disease that has not been stabilized or treated and patients who have undergone surgery in the past (less than six months) were excluded from the study.
Method
For the main analysis of MS progression, Expanded Disability Status Scale (EDSS) residual disability levels at the last consultation were grouped into 4 categories-
• EDSS<4 was denoted as minimal disability or the patient retains autonomous walking despite some impairments.
• EDSS score between 4-6 depicted moderate disability which corresponds to a progressive limitation of walking perimeter, but without assistance or rest for distances of less than 500 meters.
• EDSS score between 6-7 corresponds to severe disability which means the ability to walk with unilateral or bilateral support for no more than 100 m.
• EDSS ≥ 7 denoted severe disability where the patient walks in a wheelchair with progressive loss of the ability to manipulate it.
We withheld the EDSS score from the patient if he had the same functional status for the last six months (notion of irreversible disability).
Base-line characters
Age: The mean age of patients in our study was 41.57 ± 11.22 years, with a minimum age of 19 years and a maximum age of 69 years. 56.3% of patients were over 40 years of age (Figure 1). While the mean age of patients in our series at diagnosis was 35.23 ± 11.41 years, with a minimum age of 10 years (1 patient) and a maximum age of 69 years (1 patient), and the mean age of onset was, 31.83 ± 11.52 years and ranged from (10-65) years (Table 1). Statistical analysis showed a significant relationship between age and severity of disability (p=0.015). We found that 17 (89.4%) of the 19 patients with severe disability were over 40 years of age, and 13 (81.25%) of the 16 patients under 30 years of age had minimal to moderate disability (EDSS<6) (Table 2). A highly significant relationship was found between duration of progression and age of onset according to the log rank method (p<0.001). The duration of disease progression was very short in patients who had their onset symptoms at an advanced age (Table 3).
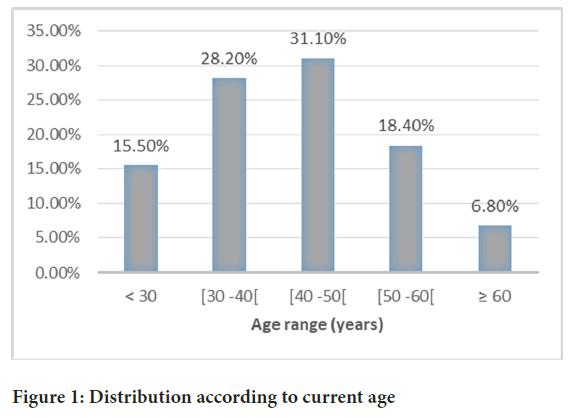
Figure 1: Distribution according to current age
| Age (y) | Minimal disability | Moderate disability | Important disability | Severe disability | Total |
|---|---|---|---|---|---|
| <30 | 6 | 7 | 2 | 1 | 16 |
| (30-40) | 8 | 6 | 14 | 1 | 29 |
| (40-50) | 7 | 3 | 12 | 10 | 32 |
| (50-60) | 7 | 3 | 5 | 4 | 19 |
| ≥ 60 | 0 | 2 | 2 | 3 | 7 |
| Total | 28 | 21 | 35 | 19 | 103 |
Table 1: Severity of disability by current age
| Severity of disability and EDSS | Effective | Percentage (%) |
|---|---|---|
| Minimal disability (EDSS<4) | 28 | 27.2 |
| Moderate disability (EDSS=4-6) | 21 | 20.4 |
| Important disability (EDSS=6-7) | 35 | 34.0 |
| Severe disability (EDSS ≥ 7) | 19 | 18.4 |
| Total | 103 | 100.0 |
Table 2: Distribution according to severity of disability at the EDSS
| Onset of age (y) | Evolution time (Age) | |
|---|---|---|
| Average (y) | Median (y) | |
| <18 | 23.467 | 26.000 |
| 18-29 | 16.920 | 17.000 |
| 30-39 | 11.110 | 11.000 |
| 40-49 | 10.943 | 12.000 |
| ≥ 50 | 4.771 | 4.000 |
| Global | 14.698 | 14.000 |
Table 3: Estimated duration of evolution by age of onset
Gender: Analysis of the results shows a predominance of females. Of the 103 patients, 71 were women (68.9%), while men accounted for 31.1% (32 patients). The female/male gender parity ratio was 2.21. Disability appears to be more severe in men. We found that the mean EDSS for men was 5.48 ± 1.81, while for women it was 4.95 ± 2.027, and that the F/H gender ratio for the minimal disability class was 3.67, while for the severe disability class the gender ratio was 1.69 (Table 4).
| Disability level | Female (F) | Male (M) | Total | F/M gender parity ratio |
|---|---|---|---|---|
| Minimal disability | 22 | 6 | 28 | 3.67 |
| Moderate disability | 14 | 7 | 21 | 2 |
| Important disability | 22 | 13 | 35 | 1.69 |
| Severe disability | 13 | 6 | 19 | 2.16 |
| Total | 71 | 32 | 103 | 2.21 |
Table 4: Distribution of disability severity by gender
It was also noted that 59.3% of men had a significant to severe disability. The median time to reach EDSS=6 (significant disability) for our patients, calculated by the Kaplan and Meier method, was 23 years, whereas it was 25 years for women and 17 years for men, meaning that disability progression is faster in men with MS (Figure 2).
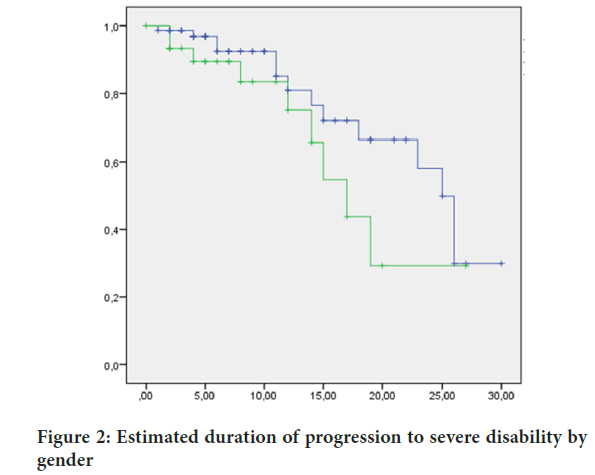
Figure 2: Estimated duration of progression to severe disability by gender
Note: ( ): Female and (
 ): Male
Place of birth and residence: We had 70 patients (68%) from Wilayas in the North of the country (the coast), 31 patients (30.1%) from the high plateau and only 2 patients from the Sahara. However, most patients (80%) in our series lived on the coast (Figure 3). Overall, the statistical analysis did not find a correlation between severity of disability and place of birth and/or residence, but it should be noted that over 57% of patients who had lived in the littoral region had a significant to severe disability, compared with 37.5% for patients living in the highlands and only 20% for patients living in the South (Table 5).
| Wilaya situation | Severity of disability (EDSS) | Total | |||
|---|---|---|---|---|---|
| Minimal disability | Moderate disability | Important disability | Severe disability | ||
| The coast (B-R) | 17-20 | 13 -15 | 27-30 | 13-17 | 70-82 |
| Highland (B-R) | 11-6 | 45.389 | 8-5 | 5-1 | 31-16 |
| Sahara (B-R) | 0-2 | 45.323 | 0-0 | 1-1 | 2-5 |
| Total | 28 | 21 | 35 | 19 | 103 |
Note: B: Birth and R: Residence
Table 5: Severity of disability by place of birth and residence

Figure 3:Distribution of MS patients by place of birth and residence
Note: ( ): Place of birth and (
 ): Place of residence
Clinical form
In our study, the clinical form was remittent in 52.4% of patients. Over half the women (57.7%) had a relapsing-remitting form, while over half the men (59.3%) had a progressive form (Table 6). The female/male gender ratio in relapsing-remitting MS was 3.15, while in Secondarily Progressive (SP) form was 1.58 and for Progressive Primary (PP) form=1.42. According to EDSS, the mean EDSS scale in our series was 5.12 ± 1.97, with a minimum of 1 and a maximum of 9.
| Clinical form | Women | Men | Total (%) |
|---|---|---|---|
| RR | 41 (75.9%) | 13 (24.1%) | 54 (52.4) |
| SP | 19 (61.3%) | 12 (38.7%) | 31 (30.1) |
| PP | 10 (58.8%) | 7 (41.2%) | 17 (16.5) |
| Benign form | 1 (100%) | 0 (0.0%) | 1 (1.0) |
| Total | 71 (68.9%) | 32 (31.1%) | 103 (100) |
Note: RR: Relapsing Remitting ; SP: Secondarily Progressive and PP: Progressive Primar
Table 6: Distribution of MS clinical forms by gender
Progression of clinical form
Statistical analysis revealed a highly significant correlation between worsening disability on the EDSS scale and the progressive form of MS (p<0.001). The mean EDSS in MS patients with RR form was lower than in patients with progressive forms (PP and SP) (Table 7).
| Sclerosis types | n | EDSS average | Deviation | Minimum | Maximum | F | p |
|---|---|---|---|---|---|---|---|
| RR | 54 | 4.04 | 1.91 | 1.00 | 7.50 | 18.551 | 0 |
| SP | 31 | 6.32 | 1.03 | 4.00 | 9.00 | ||
| PP | 17 | 6.47 | 1.29 | 4.00 | 8.50 | ||
| Total | 102 | 5.12 | 1.97 | 1.00 | 9.00 |
Note: RR: Relapsing Remitting; SP: Secondarily Progressive and PP: Progressive Primary
Table 7: Average EDSS by MS form
A significant relationship was also found between duration of evolution and the progressive form of MS according to the log rank method (p=0.006).The relapsing-remitting MS form (blue) evolves more slowly towards significant disability (EDSS ≥ 6) than the SPMS (green) and PPMS (brown) forms (Figure 4).
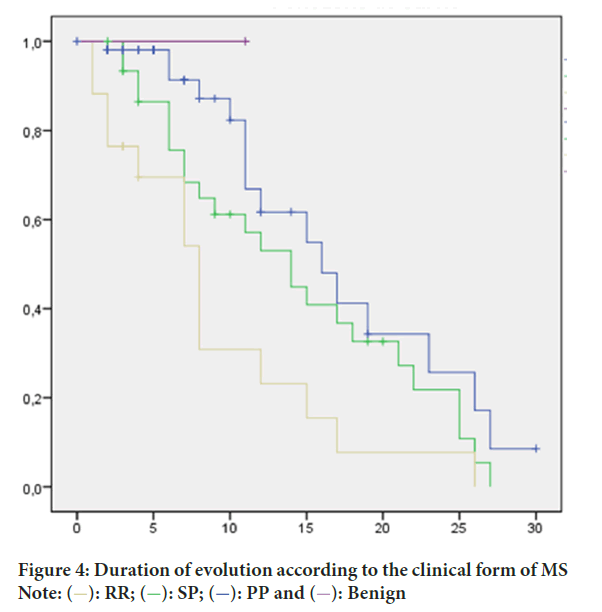
Figure 4: Duration of evolution according to the clinical form of MS
Note: ( ): RR; (
 ): SP; (
 ): PP and (
 ): Benign
Statistical analysis
Uni- and multivariate-analysis was performed using Statistical Package for Social Sciences (SPSS) 20 software. However, the Cox model retained age of onset as a prognostic factor for median EDSS disability delay ≥ 6 (Table 8).
| Multivariate analysis | B | Standard Error (SE) | Wald | dof | Significance | Exp (B) |
|---|---|---|---|---|---|---|
| Onset of age | 0.058 | 0.016 | 13.398 | 1 | 0 | 1.059 |
Note: B: Equation coefficient ; Dof: Degree of freedom and Exp (B): Odds ratio
Table 8: Multivariate analysis by Cox model
Results and Discussion
Age of onset is one of the clinical factors most strongly associated with disease progression. Thus, it is commonly accepted that an earlier age of onset is associated with a slower progression of disability and therefore a better prognosis (Renoux C, et al., 2007; Confavreux C, et al., 2003). We did not find a correlation between age of onset and severity of EDSS score, but we did find a highly significant relationship between age of onset and mean time to major to severe disability (EDSS ≥ 6) according to the Kaplan Meier-Log Rank survival curve (p<0.001).
Our results are in line with the literature, with studies by Renoux C, et al., 2007 and Confavreux C, et al., 2003 reporting that patients with an initial symptomatology at an advanced age had a short duration of evolution with a more rapid progression of disability (Tremlett H, et al., 2008; Myhr KM, et al., 2001).
The gender distribution of our patients shows a clear female predominance, with 68.9% women vs. 31.1% men, corresponding to an F/M gender ratio of 2.23 (Table 3). This female predominance is similar to that found in the literature (Drai R, 2018; Scalfari A, et al., 2010, Zakaria M, et al., 2016; Tremlett H, et al., 2008; Myhr KM, et al., 2001; Araqi-Houssaini A, et al., 2014; Sidhom Y, et al., 2015). In our study, we found that disability appears more severe in men, with a shorter duration of progression to significant disability. The mean EDSS for men was 5.48 ± 1.81, while for women it was 4.95 ± 2.027, and the F/M sex ratio for the minimal disability class was 3.67, while it was 1.69 for the major disability class. More than half the women (57.7%) had a remittent form, while more than half the men (59.4%) had a progressive form. It was also noted that 59.3% of men had significant to severe disability. Our results concur with those of most studies assessing prognosis, such as Briggs FB, et al., 2019 who reported that EDSS score progression was greater for men when all stages of the disease were included (Myhr KM, et al., 2001; Bergamaschi R, 2007; Schwendimann RN and Alekseeva N, 2007).
We found no statistically significant correlation between severity of disability and place of birth or residence, although we did note that over 57% of patients born and/or living in the coastal region had a significant to severe disability, compared with 37.5% for patients living in the highlands and only 20% for patients living in the Sahara. This result is in line with references (Lucas RM, et al., 2015; Correale J and Farez MF, 2013) showing the protective effect of latitude, ultraviolet radiation and vitamin D (Climate for traveling) (www.climatsetvoyages.com). We also noted that the patients (1 male and 1 female) in our study who were born in the South and lived there presented their first symptoms at a very advanced age (>60 years), while the three patients who were born in the north and moved to the South as adults had minimal to moderate disability. This insufficient number does not allow us to conclude on the positive (protective) role of a stay in the Sahara, particularly on the evolution of disability and MS in general. We have not found any specific study of MS in the Algerian Sahara, and studies in this area would be necessary.
In our study, the dominant clinical form was RR remitting in 52.4% of cases, followed by SP in 30.1% and PP in 16.5%. Statistical analysis showed a highly significant correlation between worsening disability on the EDSS scale and the progressive form of MS. Indeed, the mean EDSS in patients with Relapsing-Remitting (RR) MS was lower than for other progressive forms (PP and SP). Our results concur with the studies of Drai R, 2018; Confavreux C and Vukusic S, 2006; Roxburgh RH, et al., 2005, implying that relapsing-remitting MS forms have a better prognosis.
Over the last ten years, several teams have questioned the relationship between relapses and the accumulation of disability. Studies have shown that, once disability has set in and progression is underway, previous relapses and those superimposed on progression have little or no influence on the subsequent evolution of disability (Confavreux C, et al., 1980). Thus, on average, forms with remittent onset progress more slowly towards different levels of disability than those with progressive onset.
In our study, the average time between disease onset and EDSS scores 3, 4 and 6 scores at the last visit was 5.83/6/12.65 years respectively. Compared with the literature, these times are similar to those found by Drai R, 2018 for EDSS 3 and 4, but longer for EDSS 6. However, the delays remain relatively short compared with other international studies, possibly reflecting the severity of MS in a large number of our patients. And this is in line with the results reported in studies of patients of North African ethnic origin living in France, who had a more severe disease phenotype than those of French origin, so the influence of preclinical geographical area is a new prognostic factor (Jeannin S, et al., 2007; Lebrun C, et al., 2008; Sidhom Y, et al., 2017).
The median survival time from the onset of MS to the EDSS 6 score was estimated at 17 years in our series by the Kaplan-Meier technique, which is considered close to that found in the literature (Scalfari A, et al., 2010; Sidhom Y, et al., 2014; Araqi-Houssaini A, et al., 2014; Leray E, et al., 2010) (Table 9). On the other hand, it is longer in the work of the Blida team (Drai R, 2018). This difference in results can be explained by our smaller sample size, and by our lack of knowledge of the exact date of transition to this stage of disability (EDSS=6), since this is a cross-sectional study, in addition to the difference in statistical methods and software used for data analysis.
| Study of EDSS 6 delay | References |
|---|---|
| 18 | n=806 (Scalfari A, et al., 2010) |
| 18 | n=2054 (Leray E, et al., 2010) |
| 15 | n=437 (Sidhom Y, et al., 2014) |
| 7 | n=741 (Drai R, et al., 2018) |
| 17 | n=103 (Present study) |
Table 9: Average time to reach EDSS 6 compared with other studies in the literature
Conclusion
MS is a heterogeneous disease, with unpredictable symptoms, general course and functional prognosis. It is the leading cause of acquired motor disability in young adults.
The prevalence of this disease is clearly increasing in our country. And its evolutionary profile appears to be more severe. The consequences of the disease in terms of disability, handicap and impact on daily life are considerable.
Assessment of functional disorders and disability secondary to MS is the key to appropriate rehabilitation management.
References
- Pauline MA. Sclerose en plaques: Prise en charge multidisciplinaire et éducation thérapeutique du patient. 2013.
- Martin JE, Raffel J, Nicholas R. Progressive dwindling in multiple sclerosis: An opportunity to improve care. PLoS One. 2016; 11(7): e0159210.
[Crossref] [Google Scholar] [PubMed]
- Renoux C, Vukusic S, Mikaeloff Y, Edan G, Clanet M, Dubois B, et al. Natural history of multiple sclerosis with childhood onset. N Engl J Med. 2007; 356(25): 2603-2613.
[Crossref] [Google Scholar] [PubMed]
- Confavreux C, Vukusic S, Adeleine P. Early clinical predictors and progression of irreversible disability in multiple sclerosis: An amnesic process. Brain. 2003; 126(4): 770-782.
[Crossref] [Google Scholar] [PubMed]
- Tremlett H, Zhao Y, Devonshire V. Natural history of secondary-progressive multiple sclerosis. J Neurol Neurosurg Psychiatry. 2008; 14(3): 314-324.
[Crossref] [Google Scholar] [PubMed]
- Myhr KM, Riise T, Vedeler C, Nortvedt MW, Grønning M, Midgard R, et al. Disability and prognosis in multiple sclerosis: Demographic and clinical variables important for the ability to walk and awarding of disability pension. Mult Scler. 2001; 7(1): 59-65.
[Crossref] [Google Scholar] [PubMed]
- Drai R. Etude clinique et Profil évolutif des patients suivis pour une Sclérose en plaques au niveau du CHU de Blida, avec une estimation de la prévalence dans la commune de Blida. 2018.
- Scalfari A, Neuhaus A, Degenhardt A, Rice GP, Muraro PA, Daumer M, et al. The natural history of multiple sclerosis, a geographically based study 10: Relapses and long-term disability. Brain. 2010; 133(7): 1914-1929.
[Crossref] [Google Scholar] [PubMed]
- Zakaria M, Zamzam DA, Hafeez MA, Swelam MS, Khater SS, Fahmy MF, et al. Clinical characteristics of patients with multiple sclerosis enrolled in a new registry in Egypt. Mult Scler Relat Disord. 2016; 10: 30-35.
[Crossref] [Google Scholar] [PubMed]
- Araqi-Houssaini A, Lahlou I, Benkadmir Y, Elotmani H, Hajjaj I, Kissani N, et al. Multiple sclerosis severity score in a cohort of Moroccan patients. Mult Scler. 2014;20(6):1-9.
[Crossref] [Google Scholar] [PubMed]
- Sidhom Y, Kacem I, Bayoudh L, Djebara MB, Hizem Y, Abdelfettah SB, et al. Season of birth and multiple sclerosis in Tunisia. Mult Scler Relat Disord. 2015; 4(6): 491-494.
[Crossref] [Google Scholar] [PubMed]
- Sidhom Y, Damak M, Riahi A, Hizem Y, Mrissa R, Mhiri C, et al. Clinical features and disability progression in multiple sclerosis in Tunisia: Do we really have a more aggressive disease course? J Neurol Sci. 2014; 343(1-2): 110-114.
[Crossref] [Google Scholar] [PubMed]
- Briggs FB, Thompson NR, Conway DS. Prognostic factors of disability in relapsing remitting multiple sclerosis. Mult Scler Relat Disord. 2019; 30: 9-16.
[Crossref] [Google Scholar] [PubMed]
- Bergamaschi R. Prognostic factors in multiple sclerosis. Int Rev Neurobiol. 2007; 79: 423-447.
[Crossref] [Google Scholar] [PubMed]
- Schwendimann RN, Alekseeva N. Gender issues in multiple sclerosis. Int Rev Neurobiol. 2007; 79: 377-392.
[Crossref] [Google Scholar] [PubMed]
- Lucas RM, Byrne SN, Correale J, Ilschner S, Hart PH. Ultraviolet radiation, vitamin D and multiple sclerosis. Neurodegener Dis Manag. 2015; 5(5): 413-424.
[Crossref] [Google Scholar] [PubMed]
- Correale J, Farez MF. Modulation of multiple sclerosis by sunlight exposure: Role of cis-urocanic acid. J Neuroimmunol. 2013; 261(1-2): 134-140.
[Crossref] [Google Scholar] [PubMed]
- World climate information for planning a vacation (www.climatsetvoyages.com).
- Confavreux C, Vukusic S. Natural history of multiple sclerosis: A unifying concept. Brain. 2006; 129(3): 606-616.
[Crossref] [Google Scholar] [PubMed]
- Roxburgh RH, Seaman SR, Masterman T, Hensiek AE, Sawcer SJ, Vukusic S, et al. Multiple sclerosis severity score: Using disability and disease duration to rate disease severity. Neurology. 2005; 64(7): 1144-1151.
[Crossref] [Google Scholar] [PubMed]
- Confavreux C, Aimard G, Devic M. Course and prognosis of multiple sclerosis assessed by the computerized data processing of 349 patients. Brain. 1980; 103(2): 281-300.
[Crossref] [Google Scholar] [PubMed]
- Jeannin S, Bourg V, Berthier F, Lebrun C. Phenotypical aspects and clinical course of multiple sclerosis in 76 patients with a North African ethnic background followed at the Nice University Hospital. Rev Neurol. 2007; 163(4): 440-447.
[Crossref] [Google Scholar] [PubMed]
- Lebrun C, Debouverie M, Jeannin S, Pittion-Vouyovitch S, Bayreuther C, Berthier F. Impact of disease-modifying treatments in North African migrants with multiple sclerosis in France. Mult Scler. 2008; 14(7): 933-939.
[Crossref] [Google Scholar] [PubMed]
- Sidhom Y, Maillart E, Tezenas du Montcel S, Kacem I, Lubetzki C, Gouider R, et al. Fast multiple sclerosis progression in North Africans: Both genetics and environment matter. Neurology. 2017; 88(13): 1218-1225.
[Crossref] [Google Scholar] [PubMed]
- Leray E, Yaouanq J, Le Page E, Coustans M, Laplaud D, Oger J, et al. Evidence for a two-stage disability progression in multiple sclerosis. Brain. 2010; 133(7): 1900-1913.
[Crossref] [Google Scholar] [PubMed]
Author Info
Kehli M*, Doumi R, Kobci Y, Mammeri DM and Layadi KCitation: Kehli M: Association of Correlating Factors in the Progression of Irreversible Disability in Multiple Sclerosis
Received: 07-May-2024 Accepted: 23-May-2024 Published: 30-May-2024, DOI: 10.31858/0975-8453.15.5.161-165
Copyright: This is an open access article distributed under the terms of the Creative Commons Attribution License, which permits unrestricted use, distribution, and reproduction in any medium, provided the original work is properly cited.
ARTICLE TOOLS
- Dental Development between Assisted Reproductive Therapy (Art) and Natural Conceived Children: A Comparative Pilot Study Norzaiti Mohd Kenali, Naimah Hasanah Mohd Fathil, Norbasyirah Bohari, Ahmad Faisal Ismail, Roszaman Ramli SRP. 2020; 11(1): 01-06 » doi: 10.5530/srp.2020.1.01
- Psychometric properties of the World Health Organization Quality of life instrument, short form: Validity in the Vietnamese healthcare context Trung Quang Vo*, Bao Tran Thuy Tran, Ngan Thuy Nguyen, Tram ThiHuyen Nguyen, Thuy Phan Chung Tran SRP. 2020; 11(1): 14-22 » doi: 10.5530/srp.2019.1.3
- A Review of Pharmacoeconomics: the key to “Healthcare for All” Hasamnis AA, Patil SS, Shaik Imam, Narendiran K SRP. 2019; 10(1): s40-s42 » doi: 10.5530/srp.2019.1s.21
- Deuterium Depleted Water as an Adjuvant in Treatment of Cancer Anton Syroeshkin, Olga Levitskaya, Elena Uspenskaya, Tatiana Pleteneva, Daria Romaykina, Daria Ermakova SRP. 2019; 10(1): 112-117 » doi: 10.5530/srp.2019.1.19
- Dental Development between Assisted Reproductive Therapy (Art) and Natural Conceived Children: A Comparative Pilot Study Norzaiti Mohd Kenali, Naimah Hasanah Mohd Fathil, Norbasyirah Bohari, Ahmad Faisal Ismail, Roszaman Ramli SRP. 2020; 11(1): 01-06 » doi: 10.5530/srp.2020.1.01
- Manilkara zapota (L.) Royen Fruit Peel: A Phytochemical and Pharmacological Review Karle Pravin P, Dhawale Shashikant C SRP. 2019; 10(1): 11-14 » doi: 0.5530/srp.2019.1.2
- Pharmacognostic and Phytopharmacological Overview on Bombax ceiba Pankaj Haribhau Chaudhary, Mukund Ganeshrao Tawar SRP. 2019; 10(1): 20-25 » doi: 10.5530/srp.2019.1.4
- A Review of Pharmacoeconomics: the key to “Healthcare for All” Hasamnis AA, Patil SS, Shaik Imam, Narendiran K SRP. 2019; 10(1): s40-s42 » doi: 10.5530/srp.2019.1s.21
- A Prospective Review on Phyto-Pharmacological Aspects of Andrographis paniculata Govindraj Akilandeswari, Arumugam Vijaya Anand, Palanisamy Sampathkumar, Puthamohan Vinayaga Moorthi, Basavaraju Preethi SRP. 2019; 10(1): 15-19 » doi: 10.5530/srp.2019.1.3

