Research Article - (2023) Volume 14, Issue 6
Cancer Risk Assessment Based on Family History and Smoking Habits
Seyed Matin Malakouti*Abstract
Cigarette chemicals are harmful to Deoxyribonucleic Acid (DNA). Cells have a strict time repairing DNA damage due to cigarette toxins. Additionally, they break the DNA regions that guard against cancer. Cancer is caused by the accumulation of DNA damage in one cell over time. There are around sixteen cancers which cause risk to human beings due to smoking as follows-cancer of the lung, cancers of the mouth (Squamous cell carcinomas), throat, nose, and sinuses, cancers of the esophagus, cancers of the bladder and ureter (Urothelial carcinoma/transitional cell carcinoma), cancers of kidney (Renal cell carcinoma), cancer of the pancreas (Pancreatic adenocarcinoma), cancer of the stomach (Adenocarcinomas), cancer of the liver (Cholangiocarcinoma), cancer of the cervix and ovary (Ovarian cancers). However, smokers often pass away from other smoking-related conditions, including heart disease, stroke, or emphysema. About 10% to 15% of the smokers acquire lung cancer. People who never smoked or who have quit smoking years ago have also been reported to die from lung cancer. In this research, people suffering from cancer and healthy people were separated using Decision Tree, AdaBoost, and aimed to evaluate a specific gene and smoking history algorithms.
Keywords
DNA, Smoking history, Cancer, Decision tree, AdaBoost
Introduction
Colorectal Cancer (CRC) is the third most often diagnosed disease globally and the fourth most prevalent cause of cancer-related mortality, with more than one million new cases and about seven hundred thousand fatalities per year (Ferlay J, et al ., 2015). Despite recent advances in early diagnosis and treatment, almost half of patients still die within five years of their diagnosis (de Angelis R, et al ., 2014), necessitating more prognosis-improving initiatives. Smoking, a known risk factor for colorectal adenomas (Botteri E, et al ., 2008; Hoffmeister M, et al ., 2010) and CRC (Botteri E, et al ., 2008; Gong J , et al ., 2012; Hurley S, et al ., 2013; Parajuli R, et al ., 2013; Rasool S, et al ., 2013), has recently been linked to higher overall (Baer HJ, et al ., 2011; Lantz PM, et al ., 2010) and CRC-specific mortality (Botteri E, et al ., 2008; Hou L, et al ., 2014; Liang PS, et al ., 2009) in people who were previously cancer-free. Additionally, a 26% higher total mortality in incident CRC patients was found to be significantly associated with current smoking compared to never smoking (Zhu Y, et al ., 2014). The most recent meta-analysis summarised current evidence on the relationship between pre-diagnostic smoking and post-diagnostic of CRC prognosis (Aarts MJ, et al ., 2013; Ali RA, et al ., 2011; Boyle T, et al ., 2013; Cavalli-Björkman N, et al ., 2012; Daniell HW 1986; Diamantis N, et al ., 2013). Dose-response relationships between smoking intensity and projection were also noted. Of all malignancies, lung cancer has the most remarkable overall fatality rate (Jadallah F, et al ., 1999; McCleary NJ, et al ., 2010; Munro AJ, et al ., 2006; Nickelsen TN, et al ., 2005; Park SM, et al ., 2006; Phipps AI, et al ., 2011; Phipps AI, et al ., 2013; Richards CH, et al ., 2010; Sharma A, et al ., 2013; Warren GW, et al ., 2013; Walter V, et al ., 2014). Numerous studies have linked Socioeconomic Status (SES) to lung cancer, with those from lower socioeconomic origins having the most significant incidence rates (IARC, 2012; Ekberg-Aronsson M, et al ., 2006; Hart CL, et al ., 2001; Mao Y, et al ., 2001; Clegg LX, et al ., 2009; van der Heyden JH, et al ., 2009; Hrubá F, et al ., 2009; Sharpe KH, et al ., 2012; Braveman P, et al ., 2011; Adler NE and Ostrove JM, 1999). The interconnected variables of education, employment, and income are often used to measure SES, which represents one’s place in social hierarchies. Through some related pathways, including material and social resources, physical and psychosocial stresses, and health-related behaviors, SES is connected to health/disease. The most significant risk factor in the etiology of lung cancer, smoking habit, is substantially correlated with SES (Schaap MM, et al ., 2008). However, much research on lung cancer and SES fails to account for smoking behavior effectively (Sidorchuk A, et al ., 2009), and results about how much SES may be attributed to smoking vary (Menvielle G, et al ., 2009; Nkosi TM, et al ., 2012).
Materials and Methods
Research algorithms
Research algorithms can be used to determine and classify and analyze a computation. There are several research algorithms among which this study used Decision tree and AdaBoost algorithm. Decision tree: One of the well-known techniques for data categorization is the Decision tree Classifier (DTC). The most important characteristic of DTC is its capacity to transform complex decision-making issues into straightforward procedures, resulting in a solution that is clearer and simpler to perceive.
Adaboost: The Boosting approach, known as the AdaBoost algorithm, sometimes called Adaptive Boosting, is used as an Ensemble Method in machine learning. The weights are redistributed to each instance, with larger weights given to mistakenly categorized cases, thus the name “adaptive boosting.”
Data preparation
The data is divided into different genes and smoking history. These classes show the order of the genes in people with two different types of tumors (Kaggle, 2023).
Results and Discussion
Evolution process
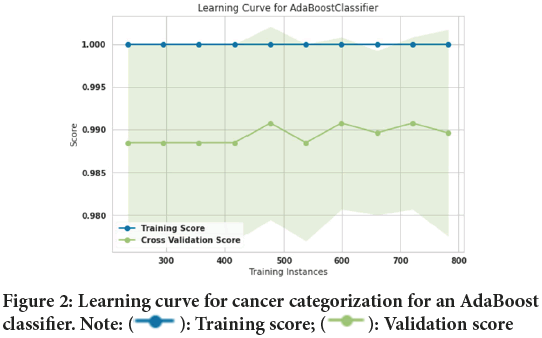
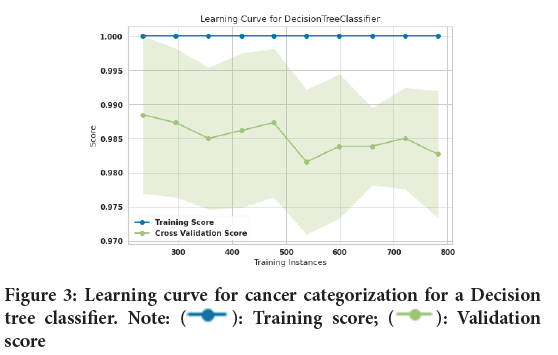
In this study, 10-fold cross-validation is used to improve the efficiency of model training. The 10-fold method divides the input data into a total of ten subsets. 9 subsets are used as training data for each round of the methods’ training, while the remaining subsets are used as test data (Malakouti SM, et al ., 2022; Malakouti SM and Ghiasi AR, 2022; Malakouti SM, et al ., 2022). Figure 1explains about the design of a typical k-fold. The input data is split into 10 subsets (where k=Ten) and the method in this study is trained for ten epochs. The assessed data includes 1022 sick individuals and healthy individuals, among which two hundred fifty-three (253) people were chosen to test the algorithms after they had been trained on 769 people. Figure 2shows the lung cancer prediction learning curve for a logistic regression classifier. After training 769 training samples, the accuracy of the training curve reached 100% and it shows that the performance of the AdaBoost classifier has been very good. Also, the accuracy of the validation curve was 98.9%. Figure 3shows the learning curve for cancer categorizing a Decision tree classifier. After training 769 training samples, the accuracy of the training curve reached 100% the accuracy of the training curve reached 100% and it shows that the performance of Decision tree classifier has been good as well. Also, the accuracy of the validation curve was 98.7%.
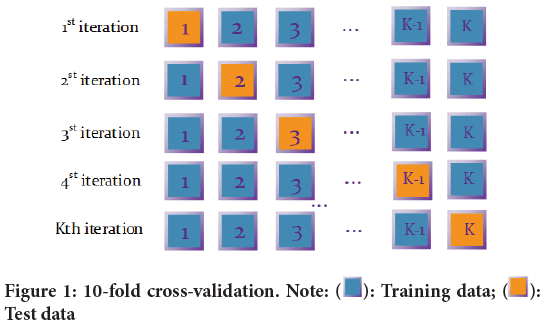
Figure 1: 10-fold cross-validation. Note:  : Training data;
  :
Test data
Figure 2: Learning curve for cancer categorization for an AdaBoost
classifier. Note:  : Training score;
  : Validation score
Figure 3: Learning curve for cancer categorization for a Decision
tree classifier. Note:  : Training score;
  : Validation
score
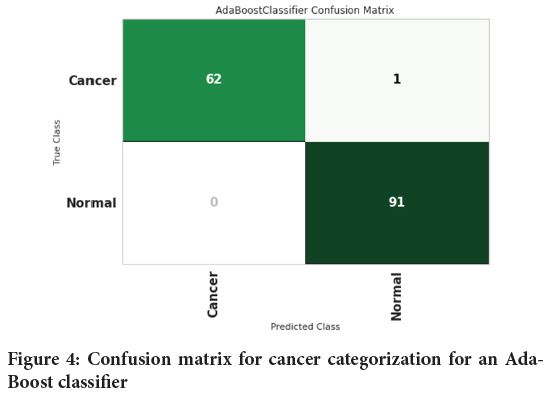
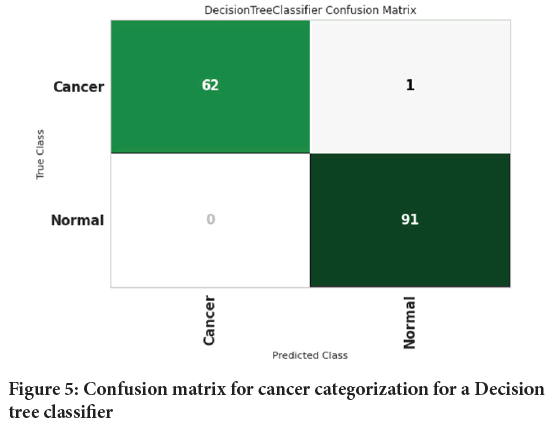
Figure 4shows the confusion matrix for cancer categorization for an AdaBoost classifier. Confusion matrix is used to measure the performance of a classification model. For this, Sixty-two (62) people with cancer and 91 healthy people were diagnosed properly. One person with cancer was wrongly diagnosed to be healthy individual. Figure 5shows the confusion matrix for cancer categorization for a Decision tree classifier.
Figure 4: Confusion matrix for cancer categorization for an Ada- Boost classifier
Figure 5: Confusion matrix for cancer categorization for a Decision tree classifier
Calculation of precision, F1, and recall
Formulae for calculating precision, F1 and recall has been described below- Precision=Patients with cancer are correctly identified as ill/patients with cancer are correctly identified as ill+patients without cancer identified incorrectly as sick;
Recall=Patients with cancer are correctly identified as ill/patients with cancer are correctly identified as ill+patients with cancer incorrectly identified as healthy.
F1=2 × Precision × Recall/Precision+Recall
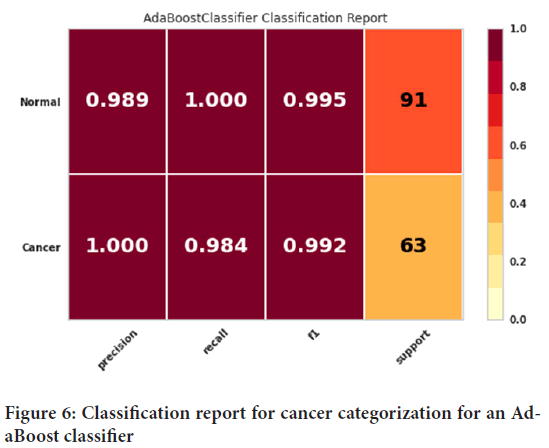
The classification report for cancer categorization for an AdaBoost classifier has been provided as shown in Figure 6. The precision, recall, and F1 score evaluation criteria can be observed in this figure. The precision evaluation criteria for people with cancer was 100%, and the precision evaluation criteria for healthy people was found to be 98.9%. The recall evaluation criteria for healthy people had 100% accuracy. Also, the evaluation criterion of recall for sick people was 98.4%. Finally, the evaluation criterion of the F1 score was 99.5% for healthy people while for that of sick people was 99.2%.
Figure 6: Classification report for cancer categorization for an AdaBoost classifier
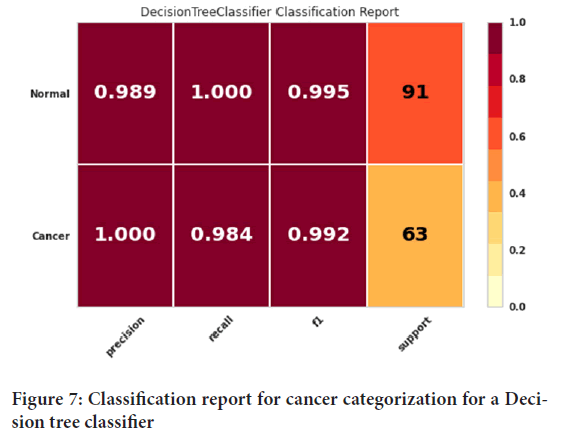
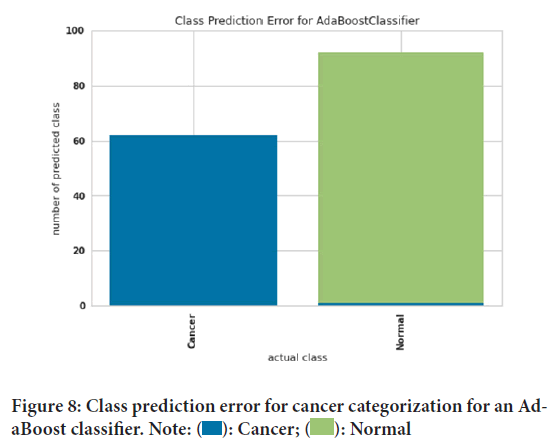
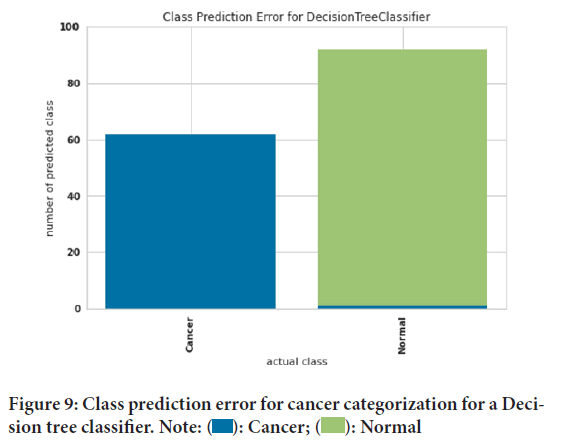
Figure 7shows the classification report for cancer categorizing a Decision tree classifier. The precision, recall, and F1 score evaluation criteria can be seen in this figure. The precision evaluation criterion for people with cancer was 100%. And the precision evaluation criterion of 98.9 was obtained for healthy people. The recall evaluation criteria for healthy people had 100% accuracy. Also, the evaluation criterion of recall for sick people was 98.4%. Finally, the evaluation criterion of the F1 score was 99.5% for healthy people and 99.2% for sick people. Class prediction error for cancer categorization for an AdaBoost classifier has been elucidated using Figure 8. Prediction error can measure the discrepancy between expectation and reality. The green color was considered for healthy people and the blue color for people with cancer. The blue color presented shows that our model did not correctly identify healthy people. The absence of green color in people with cancer indicates that people with cancer were correctly diagnosed. Figure 9shows class prediction error for cancer categorization for a Decision tree classifier. The green color was considered for healthy people and the blue color for people with cancer. The blue color in healthy people shows that our model did not correctly identify healthy people. The absence of green color in people with cancer indicates that people with cancer were correctly diagnosed. Moreover the influence of family history and smoking habits also play an important role in cancer. Ultimately, this study depicted that computational models like AdaBoost classifier Decision tree classifier can predict and diagnose particular changes which are likely to be associated with cancer.
Figure 7: Classification report for cancer categorization for a Decision tree classifier
Figure 8: Class prediction error for cancer categorization for an AdaBoost classifier. Note:  : Cancer;
  : Normal
Figure 9: Class prediction error for cancer categorization for a Decision tree classifier. Note:  : Cancer;
  : Normal
Conclusion
A person’s specific gene, family history and smoking history may be associated with the risk of cancer acquiring. This research investigated 1022 healthy and cancer patients. With the help of Decision tree and AdaBoost algorithms the precision, recall, and F1 score criteria were obtained among healthy people and people suffering with cancer. In compassion with the evaluation of AdaBoost classifier and Decision tree classifier the study found that Decision tree classifier had a same function in predicting cancer, so that the precision of people with cancer was obtained 100%. It is crucial to elaborate such computational methods, which would be beneficial for health care professional in detecting fatal illness. Further studies are required to evaluate the degree of accuracy, trueness and precision of such computational methods.
References
- Ferlay J, Soerjomataram I, Dikshit R, Eser S, Mathers C, Rebelo M, et al. Cancer incidence and mortality worldwide: Sources, methods and major patterns in GLOBOCAN 2012. Int J Cancer. 2015; 136(5): E359-E386.
[Crossref] [Google Scholar] [Pubmed]
- de Angelis R, Sant M, Coleman MP, Francisci S, Baili P, Pierannunzio D, et al. Cancer survival in Europe 1999-2007 by country and age: Results of EUROCARE-5-a population-based study. Lancet Oncol. 2014; 15(1): 23-34. [Crossref]
[Google Scholar] [Pubmed]
- Botteri E, Iodice S, Raimondi S, Maisonneuve P, Lowenfels AB. Cigarette smoking and adenomatous polyps: A meta-analysis. Gastroenterology. 2008; 134(2): 388-395.
[Crossref] [Google Scholar] [Pubmed]
- Hoffmeister M, Schmitz S, Karmrodt E, Stegmaier C, Haug U, Arndt V, et al. Male sex and smoking have a larger impact on the prevalence of colorectal neoplasia than family history of colorectal cancer. Clin Gastroenterol Hepatol. 2010; 8(10): 870-876.
[Crossref] [Google Scholar] [Pubmed]
- Botteri E, Iodice S, Bagnardi V, Raimondi S, Lowenfels AB, Maisonneuve P. Smoking and colorectal cancer: A meta-analysis. JAMA. 2008; 300(23): 2765-2778.
[Crossref] [Google Scholar] [Pubmed]
- Gong J, Hutter C, Baron JA, Berndt S, Caan B, Campbell PT, et al. A pooled analysis of smoking and colorectal cancer: Timing of exposure and interactions with environmental factors. Cancer Epidemiol Biomarkers Prev. 2012; 21(11): 1974-1985.
[Crossref] [Google Scholar] [Pubmed]
- Hurley S, Goldberg D, Nelson DO, Lu Y, Henderson K, Bernstein L, et al. Risk of colorectal cancer associated with active smoking among female teachers. Cancer Causes Control. 2013; 24: 1291-1304.
[Crossref] [Google Scholar] [Pubmed]
- Parajuli R, Bjerkaas E, Tverdal A, Selmer R, Le Marchand L, Weiderpass E, et al. The increased risk of colon cancer due to cigarette smoking may be greater in women than men. Cancer Epidemiol Biomarkers Prev. 2013; 22(5): 862-871.
[Crossref] [Google Scholar] [Pubmed]
- Rasool S, Kadla SA, Rasool V, Ganai BA. A comparative overview of general risk factors associated with the incidence of colorectal cancer. Tumour Biol. 2013; 34: 2469-2476.
[Crossref] [Google Scholar] [Pubmed]
- Baer HJ, Glynn RJ, Hu FB, Hankinson SE, Willett WC, Colditz GA, et al. Risk factors for mortality in the nurses’ health study: A competing risks analysis. Am J Epidemiol. 2011; 173(3): 319-329.
[Crossref] [Google Scholar] [Pubmed]
- Lantz PM, Golberstein E, House JS, Morenoff J. Socioeconomic and behavioral risk factors for mortality in a national 19-year prospective study of US adults. Soc Sci Med. 2010; 70(10): 1558-1566.
[Crossref] [Google Scholar] [Pubmed]
- Hou L, Jiang J, Liu B, Nasca PC, Wu Y, Zou X, et al. Association between smoking and deaths due to colorectal malignant carcinoma: A national population-based case-control study in China. Br J Cancer. 2014; 110(5): 1351-1358.
[Crossref] [Google Scholar] [Pubmed]
- Liang PS, Chen TY, Giovannucci E. Cigarette smoking and colorectal cancer incidence and mortality: Systematic review and meta‐analysis. Int J Cancer. 2009; 124(10): 2406-2415.
[Crossref] [Google Scholar] [Pubmed]
- Zhu Y, Yang SR, Wang PP, Savas S, Wish T, Zhao J, et al. Influence of pre-diagnostic cigarette smoking on colorectal cancer survival: Overall and by tumour molecular phenotype. Br J Cancer. 2014; 110(5): 1359-1366.
[Crossref] [Google Scholar] [Pubmed]
- Aarts MJ, Kamphuis CB, Louwman MJ, Coebergh JW, Mackenbach JP, van Lenthe FJ. Educational inequalities in cancer survival: A role for comorbidities and health behaviours? J Epidemiol Community Health. 2013; 67(4): 365-373.
[Crossref] [Google Scholar] [Pubmed]
- Ali RA, Dooley C, Comber H, Newell J, Egan LJ. Clinical features, treatment, and survival of patients with colorectal cancer with or without inflammatory bowel disease. Clin Gastroenterol Hepatol. 2011; 9(7): 584-589.
[Crossref] [Google Scholar] [Pubmed]
- Boyle T, Fritschi L, Platell C, Heyworth J. Lifestyle factors associated with survival after colorectal cancer diagnosis. Br J Cancer. 2013; 109(3): 814-822.
[Crossref] [Google Scholar] [Pubmed]
- Cavalli-Björkman N, Qvortrup C, Sebjørnsen S, Pfeiffer P, Wentzel-Larsen T, Glimelius B, et al. Lower treatment intensity and poorer survival in metastatic colorectal cancer patients who live alone. Br J Cancer. 2012; 107(1):189-194.
[Crossref] [Google Scholar] [Pubmed]
- Daniell HW. More advanced colonic cancer among smokers. Cancer. 1986; 58(3): 784-787.
[Crossref] [Google Scholar] [Pubmed]
- Diamantis N, Xynos ID, Amptulah S, Karadima M, Skopelitis H, Tsavaris N. Prognostic significance of smoking in addition to established risk factors in patients with Dukes B and C colorectal cancer: A retrospective analysis. J BUON. 2013; 18(1): 105-115.
[Google Scholar] [Pubmed]
- Jadallah F, McCall JL, van Rij AM. Recurrence and survival after potentially curative surgery for colorectal cancer. N Z Med J. 1999; 112(1091): 248-250.
[Google Scholar] [Pubmed]
- McCleary NJ, Niedzwiecki D, Hollis D, Saltz LB, Schaefer P, Whittom R, et al. Impact of smoking on patients with stage III colon cancer: results from Cancer and Leukemia Group B 89803. Cancer. 2010; 116(4): 957-966.
[Crossref] [Google Scholar] [Pubmed]
- Munro AJ, Bentley AH, Ackland C, Boyle PJ. Smoking compromises cause-specific survival in patients with operable colorectal cancer. Clin Oncol. 2006; 18(6): 436-440.
[Crossref] [Google Scholar] [Pubmed]
- Nickelsen TN, Jørgensen T, Kronborg O. Lifestyle and 30-day complications to surgery for colorectal cancer. Acta Oncologica. 2005; 44(3): 218-223.
[Crossref] [Google Scholar] [Pubmed]
- Park SM, Lim MK, Shin SA, Yun YH. Impact of prediagnosis smoking, alcohol, obesity, and insulin resistance on survival in male cancer patients: National Health Insurance Corporation Study. J Clin Oncol. 2006; 24(31): 5017-5024.
[Crossref] [Google Scholar] [Pubmed]
- Phipps AI, Baron J, Newcomb PA. Prediagnostic smoking history, alcohol consumption, and colorectal cancer survival: The seattle colon cancer family registry. Cancer. 2011; 117(21): 4948-4957.
[Crossref] [Google Scholar] [Pubmed]
- Phipps AI, Shi Q, Newcomb PA, Nelson GD, Sargent DJ, Alberts SR, et al. Associations between cigarette smoking status and colon cancer prognosis among participants in north central cancer treatment group phase III trial N0147. J Clin Oncol. 2013; 31(16): 2016-2023.
[Crossref] [Google Scholar] [Pubmed]
- Richards CH, Leitch EF, Horgan PG, Anderson JH, McKee RF, McMillan DC. The relationship between patient physiology, the systemic inflammatory response and survival in patients undergoing curative resection of colorectal cancer. Br J Cancer. 2010; 103(9): 1356-1361.
[Crossref] [Google Scholar] [Pubmed]
- Sharma A, Deeb AP, Iannuzzi JC, Rickles AS, Monson JR, Fleming FJ. Tobacco smoking and postoperative outcomes after colorectal surgery. Ann Surg. 2013; 258(2): 296-300.
[Crossref] [Google Scholar] [Pubmed]
- Warren GW, Kasza KA, Reid ME, Cummings KM, Marshall JR. Smoking at diagnosis and survival in cancer patients. Int J Cancer. 2013; 132(2): 401-410.
[Crossref] [Google Scholar] [Pubmed]
- Walter V, Jansen L, Hoffmeister M, Brenner H. Smoking and survival of colorectal cancer patients: Systematic review and meta-analysis. Ann Oncol. 2014; 25(8): 1517-1525.
[Crossref] [Google Scholar] [Pubmed]
- GLOBOCAN 2012: Estimated cancer incidence, mortality and prevalence worldwide in 2012. International Agency for Research on Cancer (IARC). 2012.
- Ekberg-Aronsson M, Nilsson PM, Nilsson JÅ, Pehrsson K, Löfdahl CG. Socio-economic status and lung cancer risk including histologic subtyping-a longitudinal study. Lung Cancer. 2006; 51(1): 21-29.
[Crossref] [Google Scholar] [Pubmed]
- Hart CL, Hole DJ, Gillis CR, Smith GD, Watt GC, Hawthorne VM. Social class differences in lung cancer mortality: Risk factor explanations using two Scottish cohort studies. Int J Epidemiol. 2001; 30(2): 268-274.
[Crossref] [Google Scholar] [Pubmed]
- Mao Y, Hu J, Ugnat AM, Semenciw R, Fincham S. Socioeconomic status and lung cancer risk in Canada. Int J Epidemiol. 2001; 30(4): 809-817.
[Crossref] [Google Scholar] [Pubmed]
- Clegg LX, Reichman ME, Miller BA, Hankey BF, Singh GK, Lin YD, et al. Impact of socioeconomic status on cancer incidence and stage at diagnosis: Selected findings from the surveillance, epidemiology, and end results: National longitudinal mortality study. Cancer Causes Control. 2009; 20:417-435.
[Crossref] [Google Scholar] [Pubmed]
- van der Heyden JH, Schaap MM, Kunst AE, Esnaola S, Borrell C, Cox B, et al. Socioeconomic inequalities in lung cancer mortality in 16 European populations. Lung Cancer. 2009; 63(3): 322-330.
[Crossref] [Google Scholar] [Pubmed]
- Hrubá F, Fabiánová E, Bencko V, Cassidy A, Lissowska J, Mates D, et al. Socioeconomic indicators and risk of lung cancer in central and eastern Europe. Cent Eur J Public Health. 2009; 17(3): 115-121.
[Crossref] [Google Scholar] [Pubmed]
- Sharpe KH, McMahon AD, McClements P, Watling C, Brewster DH, Conway DI. Socioeconomic inequalities in incidence of lung and upper aero-digestive tract cancer by age, tumour subtype and sex: A population-based study in Scotland (2000-2007). Cancer Epidemiol. 2012; 36(3): e164-70.
[Crossref] [Google Scholar] [Pubmed]
- Braveman P, Egerter S, Williams DR. The social determinants of health: Coming of age. Annu Rev Public Health. 2011; 32: 381-398.
[Crossref] [Google Scholar] [Pubmed]
- Adler NE, Ostrove JM. Socioeconomic status and health: What we know and what we don't. Ann N Y Acad Sci. 1999; 896(1): 3-15.
[Crossref] [Google Scholar] [Pubmed]
- Schaap MM, van Agt HM, Kunst AE. Identification of socioeconomic groups at increased risk for smoking in European countries: Looking beyond educational level. Nicotine Tob Res. 2008; 10(2): 359-369.
[Crossref] [Google Scholar] [Pubmed]
- Sidorchuk A, Agardh EE, Aremu O, Hallqvist J, Allebeck P, Moradi T. Socioeconomic differences in lung cancer incidence: A systematic review and meta-analysis. Cancer Causes Control. 2009; 20: 459-471.
[Crossref] [Google Scholar] [Pubmed]
- Menvielle G, Boshuizen H, Kunst AE, Dalton SO, Vineis P, Bergmann MM, et al. The role of smoking and diet in explaining educational inequalities in lung cancer incidence. J Natl Cancer Inst. 2009; 101(5): 321-330.
[Crossref] [Google Scholar] [Pubmed]
- Nkosi TM, Parent MÉ, Siemiatycki J, Rousseau MC. Socioeconomic position and lung cancer risk: How important is the modeling of smoking? Epidemiology. 2012; 23(3): 377-385.
[Crossref] [Google Scholar] [Pubmed]
- Smoker condition. Kaggle. 2023.
- Malakouti SM, Ghiasi AR, Ghavifekr AA, Emami P. Predicting wind power generation using machine learning and CNN-LSTM approaches. Wind Eng. 2022; 46(6): 1853-1869.
- Malakouti SM, Ghiasi AR. Evaluation of the application of computational model machine learning methods to simulate wind speed in predicting the production capacity of the Swiss basel wind farm. IEEE. 2022: 31-36.
- Malakouti SM, Ghiasi AR, Ghavifekr AA. AERO2022-flying danger reduction for quadcopters by using machine learning to estimate current, voltage, and flight area. e-Prime-Adv Electr Electron Eng. 2022; 2: 100084.
Author Info
Seyed Matin Malakouti*Citation: Malakouti SM: Cancer Risk Assessment Based on Family History and Smoking Habits
Received: 12-May-2023 Accepted: 26-May-2023 Published: 02-Jun-2023, DOI: 10.31858/0975-8453.14.6.396-400
Copyright: This is an open access article distributed under the terms of the Creative Commons Attribution License, which permits unrestricted use, distribution, and reproduction in any medium, provided the original work is properly cited.
ARTICLE TOOLS
- Dental Development between Assisted Reproductive Therapy (Art) and Natural Conceived Children: A Comparative Pilot Study Norzaiti Mohd Kenali, Naimah Hasanah Mohd Fathil, Norbasyirah Bohari, Ahmad Faisal Ismail, Roszaman Ramli SRP. 2020; 11(1): 01-06 » doi: 10.5530/srp.2020.1.01
- Psychometric properties of the World Health Organization Quality of life instrument, short form: Validity in the Vietnamese healthcare context Trung Quang Vo*, Bao Tran Thuy Tran, Ngan Thuy Nguyen, Tram ThiHuyen Nguyen, Thuy Phan Chung Tran SRP. 2020; 11(1): 14-22 » doi: 10.5530/srp.2019.1.3
- A Review of Pharmacoeconomics: the key to “Healthcare for All” Hasamnis AA, Patil SS, Shaik Imam, Narendiran K SRP. 2019; 10(1): s40-s42 » doi: 10.5530/srp.2019.1s.21
- Deuterium Depleted Water as an Adjuvant in Treatment of Cancer Anton Syroeshkin, Olga Levitskaya, Elena Uspenskaya, Tatiana Pleteneva, Daria Romaykina, Daria Ermakova SRP. 2019; 10(1): 112-117 » doi: 10.5530/srp.2019.1.19
- Dental Development between Assisted Reproductive Therapy (Art) and Natural Conceived Children: A Comparative Pilot Study Norzaiti Mohd Kenali, Naimah Hasanah Mohd Fathil, Norbasyirah Bohari, Ahmad Faisal Ismail, Roszaman Ramli SRP. 2020; 11(1): 01-06 » doi: 10.5530/srp.2020.1.01
- Manilkara zapota (L.) Royen Fruit Peel: A Phytochemical and Pharmacological Review Karle Pravin P, Dhawale Shashikant C SRP. 2019; 10(1): 11-14 » doi: 0.5530/srp.2019.1.2
- Pharmacognostic and Phytopharmacological Overview on Bombax ceiba Pankaj Haribhau Chaudhary, Mukund Ganeshrao Tawar SRP. 2019; 10(1): 20-25 » doi: 10.5530/srp.2019.1.4
- A Review of Pharmacoeconomics: the key to “Healthcare for All” Hasamnis AA, Patil SS, Shaik Imam, Narendiran K SRP. 2019; 10(1): s40-s42 » doi: 10.5530/srp.2019.1s.21
- A Prospective Review on Phyto-Pharmacological Aspects of Andrographis paniculata Govindraj Akilandeswari, Arumugam Vijaya Anand, Palanisamy Sampathkumar, Puthamohan Vinayaga Moorthi, Basavaraju Preethi SRP. 2019; 10(1): 15-19 » doi: 10.5530/srp.2019.1.3

