Research Article - (2023) Volume 14, Issue 6
Development of Validated Stability-Indicating Chromatographic Method for the Determination of Nebivolol and Valsartan and its Related Impurities in Pharmaceutical Tablets
Vaishali Gohel*, Sejalben Patel and Ujashkumar ShahAbstract
A simple, economical, precise, and selective Reverse gradient Phase High-Performance Liquid Chromatography (RP-HPLC) method has been validated and developed to estimate related impurities of Nebivolol (NEB) and Valsartan (VAL) in a tablet dosage form. A RP-HPLC analysis was performed on Hypersil BDS C18 column, and its size was 250 mm × 4.6 mm, 5 μm with using mobile phase Acetonitrile and Potassium dihydrogen phosphate (KH2PO4) with buffer pH-3.0 in the ratio of (50:50) at 282 nm detection wavelength with the flow rate of 1.0 mL/min. The analytical method was validated according to International Council for Harmonisation (ICH) guidelines. The linearity was observed in the Limit of 25-75 μg/ml range for Nebivolol and 1-15 μg/ml range for its related impurity A and B. Similarly, the 400-1200 μg/mL range was observed linearity for Valsartan. The correlation coefficient was more than 0.990 for Nebivolol, its related impurity A and B and Valartan. The % recovery value was found to be a minimum of 101.05% and a maximum of 102.07% for Nebivolol impurity A. Similarly, the % recovery value was found to be a minimum of 100.36% and a maximum of 100.87% for Nebivolol impurity B. The relative standard deviation value for repeatability, interday precision, and intraday precision was less than 5%. The Limit of Detection (LoD) value was found to be 0.017 μg/mL for Nebivolol, 0.378 μg/mL for its related impurity A and 0.071 μg/mL for its related impurity B. The LoD value was found 3.240 μg/mL for Valsartan. The LoQ value was found at 0.051 μg/ mL for Nebivolol, 1.147 μg/mL for its related impurity A and 0.216 μg/mL for its related impurity B. The LoQ value was found 9.820 μg/mL for Valsartan. The proposed method was found to be specific, linear, sensitive, precise, accurate, and robust in nature.
Keywords
ICH guidelines, Impurities, Nebivolol, Valsartan, Stability-indicating RP-HPLC, Validation
Abbreviations
NEB: Nebivolol; VAL: Valartan; RP-HPLC: Reverse Phase High Performance Liquid Chromatography; pH: Potential of Hydrogen; LOD: Limit of Detection; LOQ: Limit of Quantitation; ICH: International Conference on Harmonization; RSD: Relative Standard Deviation; NMT: Not More Than; NLT: Not Less Than; ISD: Standard Deviation; UV: Ultra Violet; PPM: Parts Per Million; BDS: Base Deactivated Silica
Introduction
Nebivolol is a beta blocker with a distinctive function which separates it from other beta blockers. It increases the production of Nitric Oxide (NO) which produces vasodilatation and thereby enhances the arterial compliance and decreases peripheral vascular resistance. It also reduces heart rate without improving maximal exercise tolerance. These effects are beneficial in hypertension and angina pectoris.
Valsartan is a potent, mighty selective and orally active antihypertensive drug belonging to the family of angiotensin II, type I receptor antagonists. Angiotensin II receptor type I antagonists have been commonly used in the therapy of hypertension, heart failure, myocardial infraction, and diabetic nephropathy.
The advantages expected from this combination are synergistic effects such as inhibition of different physiologic pathways, blockage of the Renin-Angiotensin Aldosterone system at different points, cardio-protection, and trans-inhibition of the reciprocal receptor. This drug combination is used as an antihypertensive agent (Rang HP, et al., 2011; Katzung BG, 2012) (Figures 1A and 1B).
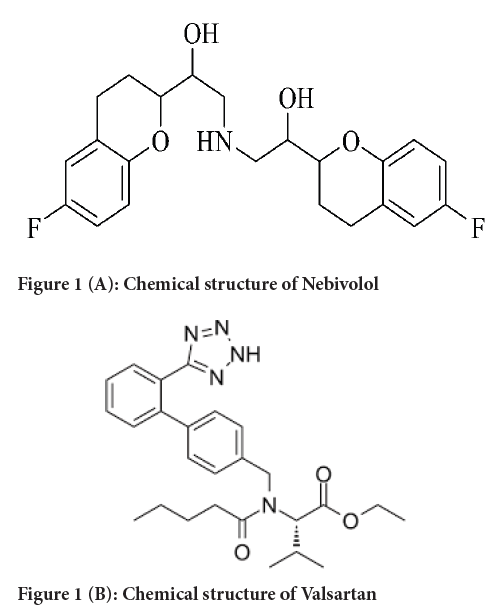
Figure 1A: Chemical structure of Nebivolol
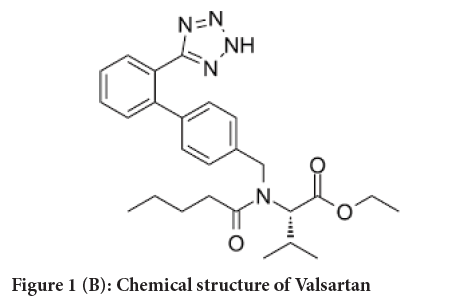
Figure 1B: Chemical structure of Valsartan
Nebivolol (NEB) chemically is 1-(6-fluoro-3,4-dihydro-2H-1- benzopyran-2-yl)-2-{[2-(6-fluoro-3,4-dihydro-2H-1-benzopyran-2-yl)-2-hydroxyethyl] amino} ethan-1-ol. It is a β-blocker, used to treat hypertension and aid in the management of heart failure (PubChem, 2021).
Valsartan (VAL) chemically is N-[p-(o-1H-Tetrazol- 5ylphenyl) benzyl]- N-valeryl-L-valine, which is an angiotensin II receptor blocker commonly used to manage hypertension alone or in combination with other antihypertensive agents and to manage heart failure in patients who are intolerant to ACE inhibitors (PubChem, 2021).
Impurity profiling is the common name of a group of analytical activities, whose aim is detection, identification/structure elucidation, and quantitative determination of identified and unidentified (organic and inorganic impurities, residual solvents) impurities in bulk drugs and pharmaceutical formulations. Since this is the best way to characterize the quality, safety, efficacy, and stability of bulk drugs and pharmaceutical formulations, this is the core activity in modern drug analysis. Impurity profiling is very crucial and critical during the synthesis of drug substances and manufacture of dosage forms, as it can provide crucial data regarding the quality, safety, efficacy, toxicity of drugs, various LoDs and LoQs, structures of several organic and inorganic impurities, usually associated with bulk drugs and finished products.
For the quality control aspects, it is essential to develop analytical methods for such combination products along with their impurities. Various sophisticated analytical techniques are described in the study to analyze Nebivolol and Valsartan either individually or in combination with other drugs by UV spectrometry method, HPLC, stability-indicating HPLC method. However, the RP-HPLC stability-indicating chromatographic method for determining Nebivolol and Valsartan with its related impurities in the dosage form is unavailable. So precise, accurate, and sensitive method for stability-indicating chromatographic method for the determination of Nebivolol and Valsartan with its related impurities was planned and validated as per Q2 (R1) guideline (ICH, 2005; ICH, 2006).
Materials and Methods
Materials
The reference standard of NEB and its related impurity A and B, as well as Valsartan, were obtained as a sample from Shanku Pharma. Methanol, water, HPLC grade of Acetonitrile, and analytical reagent grade of ortho phosphoric acid from Merck company Mumbai, were used for the study. And the commercially available tablet formulation of Nebivolol and Valsartan, Nebicard-V (Torrent Pharma Ltd.) with label claim Nebivolol 50 mg and Valsartan 80 mg were procured from the market for use.
Instrumentation
Shimadzu LC-20 AT HPLC chromatographic system, Shimadzu digital weighing balance (ATX 224), lab Scientific Pvt. Ltd pH meter, Frontline Ultrasonic Cleaner ultra-Sonicator, Indian hot air oven, and Thermolab Mumbai, were used for the method development. A 0.45 µ millipore filter was used for filtration (Sethi PD, 2010).
Chromatographic conditions
The separation of Nebivolol and Valsartan was achieved by using BDS Hypersil C18 column (250 mm × 4.6 mm, 5 µm), Acetonitrile: Buffer (pH 3.0): (50:50%, v/v) with the 1 mL/min flow rate, with an injection volume of 20.0 µL, at λmax of 282 nm, and runtime of 15 minutes.
Preparation of mobile phase: Potassium dihydrogen phosphate was prepared with 0.05 M concentration by dissolving accurately weighed 6.8 g of Potassium dihydrogen phosphate in 1000 ml HPLC grade water in a 1 L volumetric flask and pH was adjusted to pH 3.0 with O-Phosphoric Acid (OPA). The prepared buffer pH was checked by using a pH meter by ultra sonicating. For 5 minutes, the solution was degassed, and the obtained solution was filtered through a 0.45 µ millipore filter. Then the mobile phase is prepared with the ratio of Buffer (pH 3.0): Acetonitrile (50:50 v/v).Standard solutions preparation
Preparation of standard stock solution of NEB (50 ppm): The standard stock solution of NEB was prepared by accurately weighing 50 mg of NEB bulk drug into a 100 mL volumetric flask and dissolved in methanol, and it make up to the mark to get concentration of 500 μg/mL of NEB standard stock solution. For the preparation of 50 μg/ml (50 ppm) of NEB working standard solution, the NEB standard stock solution accurately took 1 mL into 10 mL volumetric flask, and the volume was made up with the mobile phase.
Preparation of standard solution of NEB impurity A (10 ppm): Standard stock solution of NEB impurity A was prepared by accurately adding 10 mg of NEB impurity A into a 100 ml volumetric flask. It was dissolved with methanol up to get 100 μg/ml of NEB impurity A, standard stock solution. For the preparation of 10 μg/mL (10 ppm) of NEB impurity A working standard solution, 1 mL of A standard stock solution was accurately taken into a 10 mL volumetric flask, and the volume was made up with the mobile phase.
Preparation of standard solution of NEB impurity B (10 ppm): Standard stock solution of NEB impurity B was prepared by accurately adding 10 mg of NEB impurity B into a 100 ml volumetric flask and dissolved with methanol up to get 100 μg/ml of NEB impurity B standard stock solution. For the preparation of 10 μg/mL (10 ppm) of NEB impurity B working standard solution, 1 mL of A standard stock solution was accurately taken into a 10 mL volumetric flask, and the volume was made up with the mobile phase.
Preparation of standard stock solution of Valsartan (800 ppm): The standard stock solution of Valsartan was prepared by accurately adding 800 mg of Valsartan into a 100 mL volumetric flask and dissolving with methanol, and making up to the mark to obtain 8000 μg/mL of Valsartan standard stock solution. For the preparation of 800 μg/mL (800 ppm) of VAL working standard solution, 1 mL of A standard stock solution was accurately taken into a 10 mL volumetric flask, and the volume was made up with the mobile phase.
Preparation of sample solution from pharmaceutical marketed tablets: About 20 tablets of Nebicard-V were weighed, and an average weight of 20 tablets was determined and powdered finely in a mortar. Powdered tablet equivalent to 5 mg of Nebivolol and 80 mg of Valsartan was accurately weighed and transferred into a 100 mL graduated flask and dissolved completely by sonicating method for 15 minutes with 60 ml of mobile phase. After ensuring complete solubilization of drugs after final sonication volume was made up with mobile phase and filtered through 0.45 micron membrane filter, and then the filtrate is collected (IP, 2007; BP, 2009; EP, 1997; USP, 2008).
Chromatographic separation
Standard solutions of Nebivolol and Valsartan, along with its related impurities, were injected 20 μL with a micro-syringe in a column. For appropriate minutes the chromatogram was run, and the detection was carried out at 282 nm wavelength. Chromatogram was stopped after separation was completely achieved. Then the data related to resolution like retention time, and peak like height, area, etc., was recorded by using the software.
Forced degradation study
To evaluate the stability-indicating properties of the developed HPLC method, forced degradation studies were carried out following the ICH guidelines to produce the possible relevant degradants and test their chromatographic behavior (ICH, 2005; ICH, 2006).
Acid degradation: 1.0 mL of the stock solution was taken into the 10 ml graduated flask and 2.0 mL of 0.1 N HCl solution was added and mixed well with this solution. It was kept for 4 hours at room temperature. After 4 hours, the resulting solution was then neutralized using 0.1 N NaOH solution and volume was adjusted with the mobile phase. After making the final solution it was run into HPLC, using which the peak area and shape were observed under optimized chromatographic conditions.
Base degradation: 1.0 mL of stock solution was taken, which was transferred into a 10 ml volumetric flask. Then 2.0 ml of 0.1 N NaOH solution was added and it was mixed well and left undisturbed for 4 hours at room temperature. After completion of 4 hours, the resulting solution was then neutralized using 0.1 N HCl solution and volume was adjusted with the mobile phase. After making the final solution, it was run into HPLC and the peak area, shape was observed under optimized chromatographic conditions.
Oxidative degradation: 1 mL of stock solution was taken and transferred into the 10 mL Erlenmeyer flask, and then 2 mL of 3.0% H2O2 solution was added and it was mixed well which was left undisturbed for 4 hours at room temperature. After completion of 4 hours, the volume was adjusted with the mobile phase. After making, the final solution was allowed to run into HPLC, and then the peak area, shape were observed under optimized chromatographic conditions.
Thermal degradation: For the dry heat degradation study, the standard powdered drugs were placed in an oven at 105°C for 24 hours. Appropriate dilutions were prepared in the mobile phase and then analyzed under the optimized chromatographic conditions.
Photolytic degradation: For the photo-degradation study, the standard powdered drugs were exposed to UV light in a photo-stability chamber for 10 hours. Appropriate dilutions were prepared using mobile phase and then analyzed under the optimized chromatographic conditions.
Method validation
The RP-HPLC developed method was validated for impurities of Nebivolol and Valsartan as per ICH guidelines. The parameters such as accuracy, system suitability, system suitability, linearity, (inter-day precision, intraday precision), LoD, LoQ, specificity, linearity and range, robustness, and system suitability were validated.
System suitability: The system suitability parameters such as retention time, theoretical plates, resolution, and tailing factor were calculated.
Specificity: The developed RP-HPLC method of specificity was established by injecting 20 µL, each of the working standard and sample solutions and blank solution.
Linearity: The linearity of a method is measured to see how well a calibration plot of response vs.concentration approximates a straight line. The linearity for NEB and its impurities and VAL were assessed by analysis of combined standard solution in a range of 25-75 μg/mL and 1-15 μg/mL and 400-1200 μg/mL respectively. Suitable aliquots of the standard stock solutions of NEB (500 μg/mL) and its impurity A and B (100 μg/mL) as well as VAL (8000 μg/mL) were transferred into a series of 10 mL volumetric flasks respectively to get different concentration levels of LoQ, like 50%, 75%, 100%, 125% and 150% of the respective standard concentration. The final volume was made up of diluents. Each mixed standard solution was injected and chromatograms were recorded. In terms of intercept, slope, correlation coefficient value, and the graph of peak area obtained vs. respective concentration was plotted.
Precision: System precision was performed by injecting six replicates of a standard solution containing NEB (50 µg/mL), its impurity A and B (10 µg/mL) and VAL (800 µg/mL) and their chromatograms, areas of peaks were recorded and measured to calculate results of repeatability. A standard solution containing NEB and its impurity A and B as well as standard solution containing of VAL were assessed on different day for three times in interday precision and the same day in intraday precision and %RSD was calculated.
Accuracy: To check the accuracy of the proposed method for determination of NEB impurity A and impurity B, recovery studies were carried out at LoQ, 80%, 100% and 120% of the test concentration according to ICH guidelines. The recovery study was performed three times at each level.
LoD and LoQ: LoD and LoQ for both the drugs and their respective impurities were estimated using the linearity data. Then LoQ and LoD were calculated with formula given below-
LoQ=10 σ/S
LoD=3.3 σ/S
Where σ= Standard deviation of the response and S=Slope of the calibration curve
Robustness: The robustness study was carried out in the chromatographic conditions to evaluate the influence of small but deliberate variations, which has been described in the chromatographic conditions section. The factors chosen for this study, which were critical sources of variability in the operating procedures, such as the ratio of mobile phase was changed as ± 2 mL, and flow rate of mobile phase was changed as ± 0.2 mL/min, and pH of mobile phase was changed ± 0.2 were identified.
Unknown impurities of NEB and VAL: The test solution was analyzed three times and calculated the percentage of each known and unknown impurities which was compared with standard preparations of NEB and VAL. The amount of known and unknown related impurities present in the formulation of NEB and VAL was calculated.
Results and Discussion
Optimization of chromatographic conditions
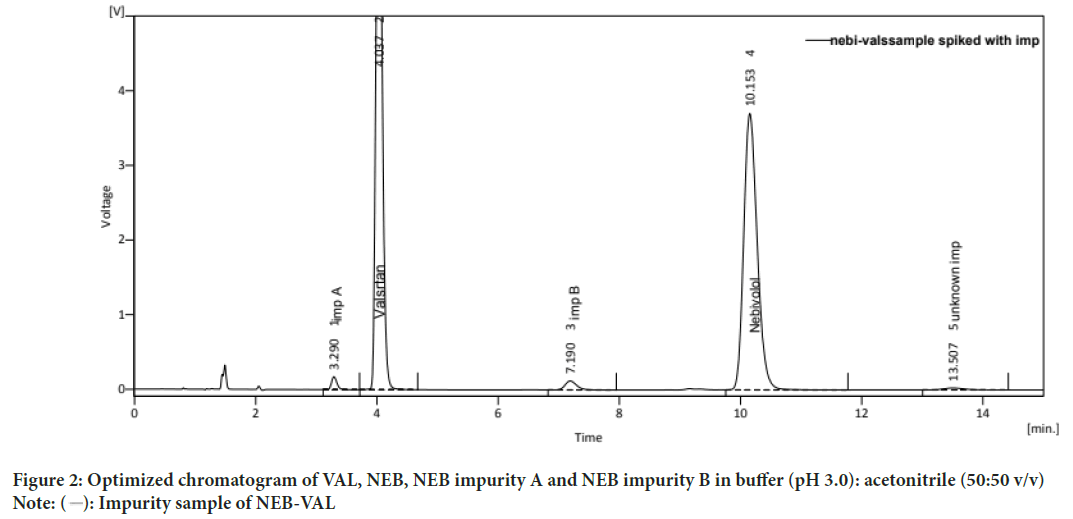
Chromatographic parameters were preliminarily optimized to develop a stability-indicating related substances method for NEB and VAL. NEB has two impurities. So these impurities need to be separated from each other and the main analyte to show the stability-indicating Related Substances method. The method development process was carried out by examining different conditions like mobile phase compositions such as water:methanol, water:acetonitrile, buffer:methanol, acetonitrile:buffer with different ratios. NEB and VAL, NEB impurity A and impurity B were found to show a significant UV absorbance at 282 nm, so this wavelength was chosen for UV detection. By the use of a C18 column, it was found that the mobile phase consisting of Buffer [Buffer (0.05 M KH2PO4 (pH 3.0):Acetonitrile (50:50)] provided a well-defined peak shape with good resolution. The peaks with Retention Time (RT) of 4.037 minutes and 10.153 minutes for VAL and NEB respectively and the retention time of NEB impurity A and NEB impurity B were found to be 3.290 minutes and 7.190 minutes, respectively (Figure 2). The representative chromatograms (Figure 2) show a significant amount of resolution and good peak shapes with the selected mobile phase. The final optimized chromatographic condition for NEB, VAL, NEB impurity A and NEB impurity B having stationary phase [BDS Hypersil C18 (250 mm × 4.6 mm, 5 μm particle size)], mobile phase and Buffer (pH 3.0): Acetonitrile (50:50 v/v) was used. The wavelength was 282 nm, with flow rate of 1 mL/min with injection volume of 20 μL for run time of 15 minutes.
Figure 2: Optimized chromatogram of VAL, NEB, NEB impurity A and NEB impurity B in buffer (pH 3.0): acetonitrile (50:50 v/v) Note:  : Impurity sample of NEB-VAL
Forced degradation studies
The sample was injected under various stress conditions. The acidic degradation, base degradation, oxidative degradation, thermal degradation and photodegradation were performed as per procedure, and % degradation was calculated from the chromatographic peaks. NEB and VAL in standard as well as sample mixture in acid degradation, base degradation, oxidative degradation, thermal degradation and photo degradation. The details of % degradation are given in the Table 1.
| Parameter (Degradation) | Nebivolol | Valsartan | ||||||
|---|---|---|---|---|---|---|---|---|
| Standard | Sample | Standard | Sample | |||||
| Area | % Degradation | Area | % Degradation | Area | % Degradation | Area | % Degradation | |
| As such | 732.31 | - | 732.31 | - | 11221.96 | - | 11221.96 | - |
| Acid | 631.432 | 13.78% | 632.833 | 13.58% | 9536.196 | 15.02% | 9671.302 | 13.82% |
| Base | 629.51 | 14.04% | 637.239 | 12.98% | 9870.238 | 12.05% | 9913.907 | 11.66% |
| Oxidative | 666.569 | 8.98% | 596.251 | 18.58% | 8774.64 | 21.81% | 9138.053 | 18.57% |
| Thermal | 666.167 | 9.03% | 659.662 | 9.92% | 9577.93 | 14.65% | 10102.28 | 9.98% |
| Photo | 636.254 | 13.11% | 596.151 | 18.58% | 9854.14 | 12.19% | 9854.14 | 12.19% |
Table 1: Results of forced degradation
Method validation
The proposed method was validated with accuracy, precision, linearity, specificity, system suitability, LoD and LoQ, and robustness.
System suitability: The system suitability was calculated using different parameters like retention time, theoretical plates, resolution, and tailing factor. System suitability was used to verify the repeatability and resolution of the system which was sufficient for the analysis intended. The system suitability parameters observed for NEB had retention time of 10.153, theoretical plates per column of 7180, and tailing factor of 1.380. The system suitability parameters observed for NEB impurity A had a retention time of 3.290, theoretical plates per column 4160, and tailing factor 1.310. The system suitability parameters observed for NEB impurity B had retention time of 7.190, theoretical plates per column 7708, and tailing factor of 1.245. The system suitability parameters observed for VAL had retention time of 4.037, theoretical plates per column 7681, and tailing factor of 1.232.
Specificity: The method’s specificity was established by studying the resolution factor of drug peaks from the nearest resolving peak and among all other peaks. The specificity of the chromatographic method was determined to ensure the separation of NEB, VAL, NEB impurity A and NEB impurity B. The chromatograms of NEB and VAL along with its related impurity of sample and standards show no interference with the chromatogram of blank, so the developed method is specific.
Linearity: The linearity for NEB and its related impurity A and B and VAL were assessed by analysis of combined standard solution within a range of 25-75 μg/mL, 1-15 μg/mL and 400-1200 μg/mL respectively. The correlation coefficient for the calibration curve of NEB and its related impurity A and B and VAL was found to be NLT 0.999, respectively (Table 2).
| S. No. | Linearity level | Valsartan | Nebivolol | Nebivolol Imp A |
Nebivolol Imp B |
Nebivolol | Nebivolol Imp A |
Nebivolol Imp B |
|
|---|---|---|---|---|---|---|---|---|---|
| Concentration (µg/mL) | Area | Concentration (µg/mL) | Area | ||||||
| 1 | 50% | 400 | 5708.907 | 25 | 5 | 5 | 365.551 | 255.615 | 672.026 |
| 2 | 75% | 600 | 8579.03 | 37.5 | 7.5 | 7.5 | 545.961 | 383.304 | 1005.326 |
| 3 | 100% | 800 | 11394.85 | 50 | 10 | 10 | 726.589 | 506.614 | 1332.721 |
| 4 | 125% | 1000 | 14326.28 | 62.5 | 12.5 | 12.5 | 916.714 | 624.612 | 1643.155 |
| 5 | 150% | 1200 | 17185.87 | 75 | 15 | 15 | 1097.643 | 759.237 | 1997.28 |
Table 2: Linearity data for valsartan, nebivolol and its related impurities
Precision (Repeatability): The repeatability data of peak area measurement for NEB and its related impurity A and B and VAL was carried out based on six measurements of same solution. The repeatability shows that the % RSD values observed within the acceptance limit of NMT 5% (Table 3).
| Concentration (µg/mL) | Area mean (n=3) |
% RSD | Concentration (µg/mL) | Area mean (n=3) | % RSD |
|---|---|---|---|---|---|
| Nebivolol | Valsartan | ||||
| Intraday precision | Intraday precision | ||||
| 25 | 370.149 | 0.732 | 400 | 5796.044 | 0.918 |
| 50 | 750.508 | 0.617 | 800 | 11750.099 | 0.198 |
| 75 | 1096.106 | 0.241 | 1200 | 17129.852 | 0.391 |
| Interday precision | Interday precision | ||||
| 25 | 376.186 | 0.688 | 400 | 5912.753 | 0.38 |
| 50 | 740.672 | 0.933 | 800 | 11580.147 | 0.774 |
| 75 | 1097.725 | 0.298 | 1200 | 17264.103 | 0.034 |
Table 3: Intraday precision and inter day precision data for estimation of valsartan, nebivolol and its related impurities
Intraday precision and inter day precision: The data for intraday precision as well as inter-day precision for NEB and its related impurity A and B and VAL is shown in Table 3. The %RSD was calculated and all values are within the acceptance limit. Hence the method is precise.
Accuracy: To check the accuracy of the proposed method for determination of NEB impurity A and for NEB impurity B, recovery studies were carried out at LoQ, 80%, 100%, and 120% of the test concentration according to ICH guidelines. The method accuracy was established by a recovery study from marketed formulation at three levels of standard addition. The percentage recovery for NEB impurity A was 101.05% to 102.07%, and the percentage recovery for NEB Impurity B was 100.36% to 100.87% (Table 4).
| Concentration level (%) | Area of recovery spiked with test | Area of impurity in test | Net area of standard | Area of standard | Amount added (µg/ml) | Amount recovered (µg/mL) | % Recovery | % RSD | |
|---|---|---|---|---|---|---|---|---|---|
| Nebivolol impurity A | |||||||||
| 80% | 957.049 | 550.021 | 507.628 | 504.246 | 8 | 8.068 | 100.85 | 1.3 | |
| 953.051 | 550.021 | 504.077 | 504.246 | 8 | 7.988 | 99.86 | |||
| 963.423 | 550.021 | 501.033 | 504.246 | 8 | 8.194 | 102.43 | |||
| 100% | 1056.435 | 550.021 | 504.246 | 504.246 | 10 | 10.039 | 100.39 | 1.8 | |
| 1063.752 | 550.021 | 504.077 | 504.246 | 10 | 10.184 | 101.84 | |||
| 1074.439 | 550.021 | 501.033 | 504.246 | 10 | 10.396 | 103.96 | |||
| 120% | 1160.892 | 550.021 | 507.628 | 504.246 | 12 | 12.11 | 100.92 | 1.07 | |
| 1172.523 | 550.021 | 504.077 | 504.246 | 12 | 12.341 | 102.84 | |||
| 1161.898 | 550.021 | 501.033 | 504.246 | 12 | 12.13 | 101.08 | |||
| Nebivolol impurity B | |||||||||
| 80% | 1332.967 | 273.144 | 1335.391 | 1321.694 | 8 | 8.018 | 100.23 | 0.71 | |
| 1327.612 | 273.144 | 1325.988 | 1321.694 | 8 | 7.978 | 99.72 | |||
| 1342.432 | 273.144 | 1303.703 | 1321.694 | 8 | 8.09 | 101.12 | |||
| 100% | 1592.468 | 273.144 | 1335.391 | 1321.694 | 10 | 9.982 | 99.82 | 1.03 | |
| 1603.463 | 273.144 | 1325.988 | 1321.694 | 10 | 10.065 | 100.65 | |||
| 1619.566 | 273.144 | 1303.703 | 1321.694 | 10 | 10.187 | 101.87 | |||
| 120% | 1866.305 | 273.144 | 1335.391 | 1321.694 | 12 | 12.053 | 100.44 | 0.65 | |
| 1884.888 | 273.144 | 1325.988 | 1321.694 | 12 | 12.194 | 101.62 | |||
| 1867.682 | 273.144 | 1303.703 | 1321.694 | 12 | 12.064 | 100.53 | |||
Table 4: Recovery data for nebivolol impurity A and nebivolol impurity B
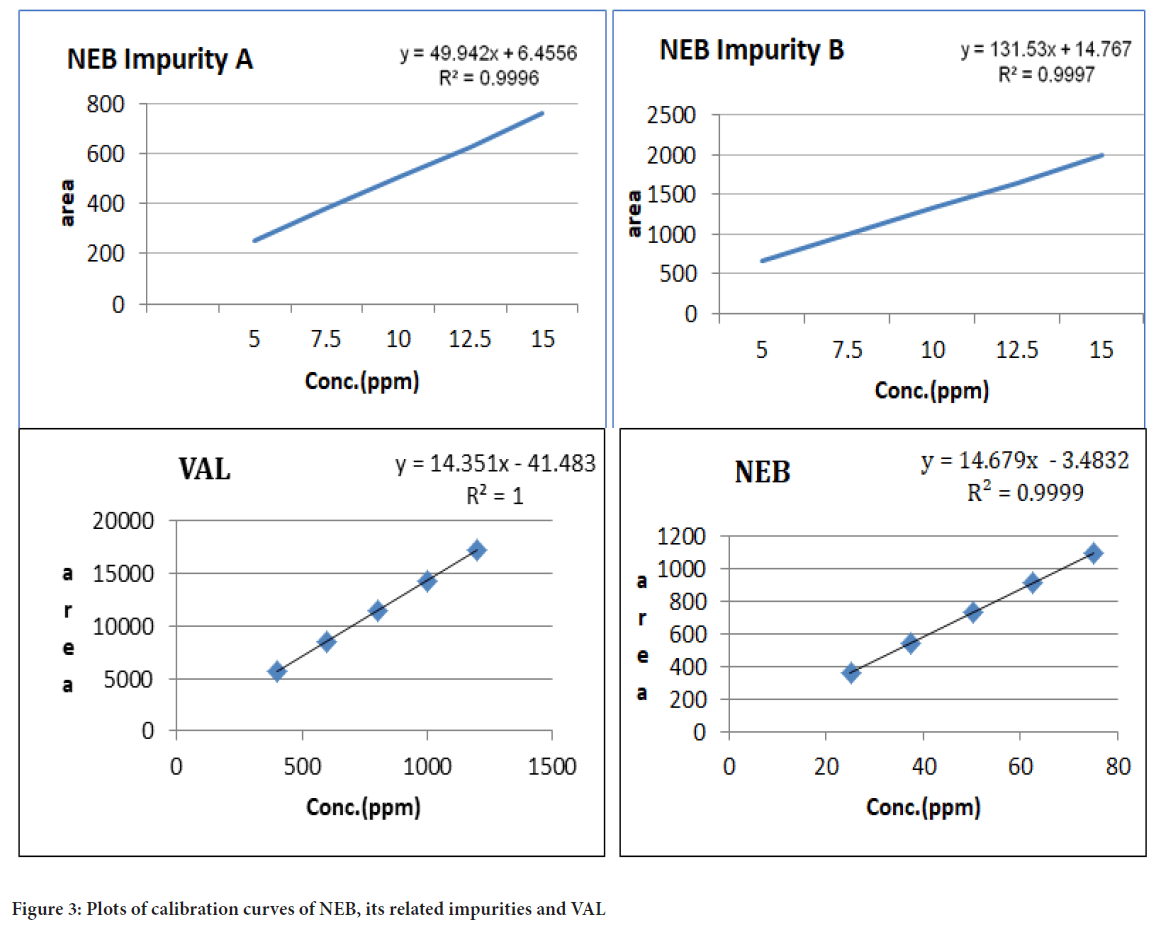
LoD and LoQ: Limit of detection and limit of quantitation for both the drugs and their respective impurities were estimated using the linearity data (Figure 3). Repeated calibration curve 5 times and calculated standard deviation of the intercepts. The Limit of Detection (LoD) value was found to be 0.017 µg/mL for Nebivolol, 0.378 µg/mL for its related impurity A and 0.071 µg/mL for its related impurity B. The LoD value was found 3.240 µg/mL for Valsartan. The LoQ value was found at 0.051 µg/mL for Nebivolol, 1.147 µg/mL for its related impurity A and 0.216 µg/mL for its related impurity B. The LoQ value was found 9.820 µg/mL for Valsartan.
Figure 3: Plots of calibration curves of NEB, its related impurities and VAL
Robustness: The robustness study was carried out to assess the influence of small but deliberate variations in the chromatographic conditions. The chromatographic factors, i.e., the ratio of mobile phase was changed ± 2 mL and flow rate of mobile phase ± 0.2 mL/min was changed and pH of mobile phase was changed ± 0.2 mL without changing the mobile phase components and their effect observed on system suitability for standard preparation. The results show that the changing effect was found to be within the acceptance criteria and the %RSD values were observed within the standard limit of not more than 5%.
Unknown impurities of NEB: The proposed method’s appropriateness was tested by analyzing the commercially available tablet formulation Nebicard-V. The results of known and unknown impurities are calculated in % RSD. The %RSD for NEB impurity A observed was 1.059% while NEB impurity B observed was at 1.717%. If the %RSD values were observed within the standard limit of not more than 5%, then the results indicate that the developed method is accurate, simple, precise, and rapid and it can be used in the regular quality control of dosage forms in industries.
RP-HPLC method was validated according to ICH guidelines. And it was found to be linear, within the range correlation co-efficient for calibration curve of NEB and its related impurity A and B and VAL was found to be NLT 0.999 respectively. The accuracy of the method was determined at 80%, 100%, and 120% levels. The percentage recovery for NEB impurity A was 101.05% to 102.07%, and the percentage recovery for NEB impurity B was 100.36% to 100.87%. The LoD value was found to be 0.017 µg/mL for Nebivolol, 0.378 µg/mL for its related impurity A and 0.071 µg/mL for its related impurity B. The LoD value was found to be 3.240 µg/mL for Valsartan. The LoQ value was found at 0.051 µg/mL for Nebivolol, 1.147 µg/mL for its related impurity A and 0.216 µg/mL for its related impurity B. The LoQ value was found 9.820 µg/mL for Valsartan indicating the sensitivity of the method (Table 5). The method developed was found to be precise as the %RSD values for intra-day and inter-day were found to be less than 5.0%. And the method was also found to be robust, indicated by the %RSD values of less than 5%.
| S. No | Area at flow rate (+0.2 mL/min) | Area at flow rate (-0.2 mL/min) | Area at pH (+0.2) | Area at pH (-0.2) | Area at mobile phase (+0.2 mL/min) | Area at mobile phase (-0.2 mL/min) | ||
|---|---|---|---|---|---|---|---|---|
| Nebivolol | ||||||||
| 1 | 584.342 | 874.715 | 710.767 | 742.871 | 727.299 | 743.700 | ||
| 2 | 593.183 | 876.371 | 704.921 | 744.254 | 719.683 | 746.822 | ||
| 3 | 596.623 | 884.801 | 709.038 | 745.582 | 725.297 | 744.254 | ||
| %RSD | 1.071 | 0.616 | 0.424 | 0.182 | 0.545 | 0.224 | ||
| Nebivolol impurity A | ||||||||
| 1 | 515.187 | 488.107 | 512.688 | 497.558 | 509.637 | 498.069 | ||
| 2 | 520.875 | 484.679 | 518.347 | 503.043 | 504.546 | 493.093 | ||
| 3 | 526.090 | 480.325 | 513.149 | 510.089 | 511.113 | 497.048 | ||
| %RSD | 1.047 | 0.805 | 0.611 | 1.247 | 0.678 | 0.530 | ||
| Nebivolol Impurity B | ||||||||
| 1 | 1355.265 | 1284.088 | 1348.749 | 1308.994 | 1340.071 | 1310.026 | ||
| 2 | 1370.221 | 1275.043 | 1363.584 | 1308.206 | 1327.305 | 1293.444 | ||
| 3 | 1381.471 | 1254.483 | 1349.936 | 1335.462 | 1330.060 | 1307.606 | ||
| %RSD | 0.960 | 1.193 | 0.609 | 1.177 | 0.504 | 0.687 | ||
| Valsartan | ||||||||
| 1 | 9140.327 | 13718.654 | 11109.866 | 11632.316 | 11331.528 | 11617.999 | ||
| 2 | 9288.420 | 13769.117 | 11121.373 | 11616.862 | 11327.246 | 11670.714 | ||
| 3 | 9297.116 | 13873.699 | 11118.583 | 11634.555 | 11329.446 | 11595.063 | ||
| %RSD | 0.953 | 0.574 | 0.054 | 0.083 | 0.019 | 0.334 | ||
Table 5: Robustness data for valsartan, nebivolol and its related impurities
Conclusion
There is no analytical work which has been available regarding the related impurities of RP-HPLC method for NEB and VAL in the literature. Data regarding the behaviour of the drug and its related impurities in chromatographic conditions and other relevant analytical properties are not available. It is a novel attempt in a field of research that has been made to validate and develop the related impurities method viaRP-HPLC. Conclusively, the RP HPLC method described in this paper is specific, sensitive, rapid, and easy to perform. The proposed RP-HPLC method enables the simultaneous estimation of NEB and VAL and its related impurities. This method provides good separation and resolution of the chromatographic peaks of the NEB and VAL and its related impurities. The 0.05 M Potassium dihydrogen phosphate (pH 3.0):Acetonitrile (50:50 v/v) was used as the mobile phase. The sample recoveries from all formulations agreed with their respective label claims, which suggested non-interference of formulations excipients in the estimation. The method was successfully validated in terms of specificity, precision, linearity, accuracy, and robustness as per ICH guidelines. It can be concluded that the proposed method can be used for routine analysis for estimation of related impurities of NEB and VAL in combined dosage form by RP-HPLC.
References
- Rang HP, Dale MM, Ritter JM, Flower RJ, Henderson G. Rang and Dale's pharmacology. Elsevier Health Sciences. 2011.
- Katzung BG. Basic and clinical pharmacology. 2012.
- Nebivolol. PubChem. 2021.
- Valsartan. PubChem. 2021.
- Validation of analytical procedures: Text and methodology Q2(R1). International Conference on Harmonisation (ICH). 2005.
- Impurities in new drug product. ICH Q3B (R1). International Conference on Harmonisation (ICH). 2006.
- ICH. Impurities in new drug substances Q3A (R2). International Conference on Harmonisation (ICH). 2006.
- Sethi PD. Sethi's HPLC: High performance liquid chromatography: Quantitative analysis of pharmaceutical formulations. CBS. 2010.
- The Indian Pharmacopoeia Commission, Vol 1. The Indian Pharmacopoeia (IP) commission Ghaziabad. 2007.
- British Pharmacopoeia (BP) (volume 1 and 2). Majesty’s Stationery Office, UK. 2009.
- European Pharmacopoeia (EP) (edition 3). Council of Europe, France. 1997.
- The United States Pharmacopoeia (USP). 31 Revision, US Pharmacopoeial convention. 2008.
Author Info
Vaishali Gohel*, Sejalben Patel and Ujashkumar ShahCitation: Gohel V: Development of Validated Stability-Indicating Chromatographic Method for the Determination of Nebivolol and Valsartan and its Related Impurities in Pharmaceutical Tablets
Received: 12-May-2023 Accepted: 26-May-2023 Published: 02-Jun-2023, DOI: 10.31858/0975-8453.14.6.411-417
Copyright: This is an open access article distributed under the terms of the Creative Commons Attribution License, which permits unrestricted use, distribution, and reproduction in any medium, provided the original work is properly cited.
ARTICLE TOOLS
- Dental Development between Assisted Reproductive Therapy (Art) and Natural Conceived Children: A Comparative Pilot Study Norzaiti Mohd Kenali, Naimah Hasanah Mohd Fathil, Norbasyirah Bohari, Ahmad Faisal Ismail, Roszaman Ramli SRP. 2020; 11(1): 01-06 » doi: 10.5530/srp.2020.1.01
- Psychometric properties of the World Health Organization Quality of life instrument, short form: Validity in the Vietnamese healthcare context Trung Quang Vo*, Bao Tran Thuy Tran, Ngan Thuy Nguyen, Tram ThiHuyen Nguyen, Thuy Phan Chung Tran SRP. 2020; 11(1): 14-22 » doi: 10.5530/srp.2019.1.3
- A Review of Pharmacoeconomics: the key to “Healthcare for All” Hasamnis AA, Patil SS, Shaik Imam, Narendiran K SRP. 2019; 10(1): s40-s42 » doi: 10.5530/srp.2019.1s.21
- Deuterium Depleted Water as an Adjuvant in Treatment of Cancer Anton Syroeshkin, Olga Levitskaya, Elena Uspenskaya, Tatiana Pleteneva, Daria Romaykina, Daria Ermakova SRP. 2019; 10(1): 112-117 » doi: 10.5530/srp.2019.1.19
- Dental Development between Assisted Reproductive Therapy (Art) and Natural Conceived Children: A Comparative Pilot Study Norzaiti Mohd Kenali, Naimah Hasanah Mohd Fathil, Norbasyirah Bohari, Ahmad Faisal Ismail, Roszaman Ramli SRP. 2020; 11(1): 01-06 » doi: 10.5530/srp.2020.1.01
- Manilkara zapota (L.) Royen Fruit Peel: A Phytochemical and Pharmacological Review Karle Pravin P, Dhawale Shashikant C SRP. 2019; 10(1): 11-14 » doi: 0.5530/srp.2019.1.2
- Pharmacognostic and Phytopharmacological Overview on Bombax ceiba Pankaj Haribhau Chaudhary, Mukund Ganeshrao Tawar SRP. 2019; 10(1): 20-25 » doi: 10.5530/srp.2019.1.4
- A Review of Pharmacoeconomics: the key to “Healthcare for All” Hasamnis AA, Patil SS, Shaik Imam, Narendiran K SRP. 2019; 10(1): s40-s42 » doi: 10.5530/srp.2019.1s.21
- A Prospective Review on Phyto-Pharmacological Aspects of Andrographis paniculata Govindraj Akilandeswari, Arumugam Vijaya Anand, Palanisamy Sampathkumar, Puthamohan Vinayaga Moorthi, Basavaraju Preethi SRP. 2019; 10(1): 15-19 » doi: 10.5530/srp.2019.1.3

