


Google Scholar citation report
Citations : 25586
Systematic Reviews in Pharmacy received 25586 citations as per google scholar report
Systematic Reviews in Pharmacy peer review process verified at publons
Indexed In
Research Article - (2022) Volume 13, Issue 2
Development, Validation, and Concentration Determination of Losartan Potassium Using 1D UV Visible Spectrophotometry
Maneesha C Abeysekera, Muditha B Herath, Shehani H Basnagoda and Udaya K Jayasundara*Abstract
Losartan Potassium (LP) is a non-peptide antihypertensive agent that manifests its effect by specifically blocking angiotensin II receptors which are used to treat hypertension. This research was carried out to develop and validate a simple and accurate Ultraviolet- Visible (UV-Vis) spectrometric method to determine the Active Pharmaceutical Ingredient (API) content in commercially available LP formulations stored at room temperature and refrigerator conditions. All the parameters were validated following the International Conference on Harmonization (ICH) guidelines. An intense peak at 234 nm was observed for the first derivative 1D UV spectrum of LP and it was taken for the quantitative evaluation. Accuracy was tested with the spiked recovery method and the percentage recovery was observed in the range of 90% to 110%. Precision was evaluated utilizing intra-day and inter-day precisions giving a percent Relative Standard Deviation (%RSD) ≤ 2 for each concentration. Linearity was found in the range of 5-15 ppm with a correlation coefficient (R2) of 0.994. Limit of Detection (LOD) and Limit of Quantitation (LOQ) were found to be 0.489 ppm and 1.511 ppm, respectively. Stability testing revealed that standard and test solutions are stable up to 14 days under room temperature and refrigerator conditions and met the acceptance criteria of ± 10% deviation from the initial value. Market sample analysis was carried out using the percentage recovery method. All the samples met the acceptance criteria suggested by the ICH. Hence, the developed method was found to be a simple, sensitive, and economical procedure that does not employ any harmful reagents.
Keywords
Losartan Potassium (LP), 1D UV-Vis spectroscopy, ICH guidelines, Method validation, Sample analysis, Acceptance criteria
Introduction
Pharmaceutical drugs are substances that could cure, prevent, mitigate, or treat a disease or which can affect the structure or any function of the human or animal body. Losartan Potassium (LP) is one of the highly demanded medicines, which has been listed by the World Health Organization (WHO) as an essential medicine (World Health Organization, 2019). The LP (2-butyl-4-chloro-1- [p-o-1H-tetrazol-5-ylphenl) benzyl] imidazole-5-methanol monopotassium salt) is a non-peptide antihypertensive agent (Bonfilio R, et al., 2010). This drug is mainly used as an effective treatment for hypertension (Ripley E and Hirsch A, 2010; Costagliola C, et al., 2000). Besides, it has been proved to be effective for patients with heart failures and patients with type II diabetes, which leads to chronic renal failure (Brenner BM, et al., 2001).
Losartan Potassium is an off-white crystalline solid which is readily soluble in water and alcohol (Ashraf Z, et al., 2015). This drug is administered in the form of oral tablets. It acts as a competitive antagonist with specific and selective binding to type I Angiotensin II receptor (AT1) and blocks the action of angiotensin, relaxes muscles, dilates blood vessels, and lowers blood pressure (Bonfilio R, et al., 2010; Brenner BM, et al., 2001; Ashraf Z, et al., 2015; Goa KL and Wagstaff AJ, 1996). Also, LP inhibits the binding of angiotensin II to type I tissues in kidney and adrenal glands which decreases the water and salt retention and increases excretion (Ashraf Z, et al., 2015). The chemical structure of LP is shown in Figure 1.

Figure 1: Potassium (2-butyl-4-chloro-1{[2(1H-tetrazol-5-yl) biphenyl-4-yl] methyl} 1H-imidazol-5-yl) methanol
The quality and the quantity (dose) of a drug are decisive factors that assure effectiveness and efficiency. Active Pharmaceutical Ingredient (API) is a substance or a mixture of substances that directly affects the pharmacological activity of a drug. In the pharmaceutical research and development stage, different techniques are utilized to accurately determine the API concentration in a drug along with other excipients. It has been reported that the determination of LP employs several analytical techniques such as Liquid Chromatography (LC) (Williams RC, et al., 1996), High Performance Liquid Chromatography (HPLC) (Soldner A, et al., 1998; Lastra OC, et al., 2003), Capillary Electrophoresis (CE), Super Critical Fluid Chromatography (SFC) (Williams RC, et al., 1996; de Oliveira RP, et al., 2012), and High Performance Thin Layer Chromatography (HPTLC) (Bonfilio R, et al., 2010; Stolarczyk M, et al., 2013; Lusina M, et al., 2005). These methods are relatively more expensive, need special skills to handle the instrument, and sometimes employ hazardous solvents. Ultra Violet- Visible spectrometry is one of the most common and easy to handle techniques used in the pharmaceutical industry as it is a simple, accurate, specific, and sensitive method (Jayasundara UK, et al., 2021).
An analytical procedure must be authenticated before concentration determination, and it is called “method validation” according to standards. There are several standards to be adhered to when a method is validated such as United States Pharmacopoeia (USP), Japanese Pharmacopoeia (JP), and European Union (EU) along with International Conference on Harmonization (ICH) guidelines (Kameyama Y, et al., 2019). Depending on the region and the requirements, a pharmaceutical manufacturer may use one or more standards. Method validation is used to identify to what extent the results are reproducible and reliable as well as whether the developed analytical technique is suitable for the intended use. Accuracy, precision, specificity, Limit of Detection (LOD), Limit of Quantitation (LOQ), linearity, range, and stability is the common method validation parameters according to the ICH guidelines (Lastra OC, et al., 2003; Borman P and Elder D, 2017; Tijare LK, et al., 2016; Salomi P, et al., 2018) and these are equally important to meet the acceptance criteria (Borman P and Elder D, 2017). Stability testing is also an essential part of the drug development and analysis process. The stability of a drug formulation will reveal whether there is any alteration during storage that could affect the quality, safety, and efficacy in the cause of time (Ashraf Z, et al., 2015; Lusina M, et al., 2005; Siddiqui MR, et al., 2017).
In this work, an attempt was made to develop and validate a simple but fast analytical procedure using UV-Vis spectrophotometry to determine the API content of LP (Ashraf Z, et al., 2015; Lastra OC, et al., 2003). The validation parameters were tested according to ICH guidelines and the method was applied to commercially available LP tables to determine the actual API content. Further, the stability of the method was investigated to make the method cost-effective.
Methodology
Standard and test materials
The LP standard was obtained from State Pharmaceutical Manufacturing Co-operation (SPMC), Ratmalana, Sri Lanka. Six brands (A-F) of LP 50 mg tablets were purchased from local pharmacies in Colombo District for market sample analysis. The de-ionized water required for the analysis was obtained from the in-house supply.
Apparatus and instrumentation
UV-Visible double beam spectrophotometer (HITACHI U-2910) located in the institute laboratory was used to measure the absorbance of all prepared samples.
Solubility and purity determination
Losartan Potassium was soluble in de-ionized water hence, no further chemical treatment was done to increase the solubility. However, this solution was sonicated in the water bath (Daihan Scientific, Korea, Model: Maxturdy-30) for five minutes to facilitate the dissolution. The purity of the standard was tested by measuring the melting point and it was revealed that the melting point of LP was in the range of 263-265°C which confirmed the standard was suitable for method validation (Ashraf Z, et al., 2015).
Selection of wavelength
A standard stock solution of 100 ppm was prepared by dissolving and sonicating 10.0 mg of LP standard in 100.0 mL of deionized water. A 10 ppm solution was prepared by diluting the 100 ppm standard solution. Subsequently, the absorption spectrum was recorded in the range 200 nm-400 nm using UV-visible Spectrophotometer to obtain the maximum absorption wavelength.
Preparation of LP standard calibration curve
A 10 mg sample of LP standard was weighed accurately and transferred into a 100 mL volumetric flask and dissolved in deionized water and sonicated for 5 minutes to prepare a 100 ppm standard stock solution. This procedure was triplicated to increase reproducibility.
The standard stock solutions were used to prepare a calibration standard ranging 5 ppm to 15 ppm and the absorbance of LP was measured using the UV-Visible spectrophotometer set at 234 nm which was determined in the previous section (Ripley E and Hirsch A, 2010; de Oliveira RP, et al., 2012).
Each concentration was prepared in triplicate using three stock solutions. The absorbances were measured for each sample in triplicate.
Test sample preparation
Five tablets from each brand were taken and crushed well using a mortar and a pestle until the approximately uniform powder was obtained. The average weight of the powdered yielded was measured. A 10 mg of the crushed sample was measured accurately, transferred into a 100 mL volumetric flask, and dissolved in de-ionized water. The sample was sonicated for about 5 minutes to increase the solubility. The test sample solution was then filtered to remove undissolved particles. The absorbance was measured at 234 nm. The sample preparation and absorbance measurement were triplicated.
Software used
All the statistical data were analyzed using Microsoft office excel (Microsoft apps for enterprise), Origin 8.1 (2018) packages, and the ChemSketch software package was used to draw structures.
Results and Discussion
Selection of wavelength
The zero-order (0-D) spectrum of the 10 ppm LP standard solution revealed that the maximum absorption wavelength (λmax) could not be accurately determined as shown in Figure 2. Therefore, the first derivative (1-D) spectrum was calculated by instrumental electronic differentiation, and it is shown in Figure 3. Figure 3 clearly shows an intense negative peak at 234 nm (shows in an arrow) which was verified with the literature data (Bonfilio R, et al., 2010; Lastra OC, et al., 2003). Therefore, the wavelength of 234 nm was used to measure the absorbance of all standard and test solutions.

Figure 2: The zero-order spectrum of Losartan Potassium (LP) in aqueous solution (10 ppm)

Figure 3: The first-derivative spectrum of LP in aqueous solution (10 ppm). The pointed arrow shows the wavelength selection for the study
Method validation
The developed method was validated for accuracy, precision, specificity, Limit of Detection (LOD), Limit of Quantitation (LOQ), linearity, range, and stability.
Accuracy: The accuracy of the method was determined using the standard addition method at 3 recovery levels namely 50%, 100%, and 150%. The standard solutions of 5 ppm LP were spiked with all test sample solutions and corresponding absorbance values were measured at 234 nm. The accepted criterion for accuracy is ± 10% deviation from the initial concentration. The recovery percentage was evaluated using equation (1).

For each concentration level, two randomly selected brand types from A to F were evaluated. Table 1 shows that A and B have a recovery percentage between 90% and 110%. This satisfies the ICH guidelines for accuracy which lies in between 10% deviation.
| Recovery level (%) | Brand | Concentration of tablet (ppm) | Concentration of standard (ppm) | Total amount of API (ppm) | Recovered amount (ppm) | Recovery (%) |
|---|---|---|---|---|---|---|
| 50 | A | 5 | 2.5 | 7.5 | 7.4 | 98.67 |
| B | 5 | 2.5 | 7.5 | 7.67 | 102.27 | |
| 100 | A | 5 | 5 | 10 | 9.52 | 95.2 |
| B | 5 | 5 | 10 | 10.48 | 104.8 | |
| 150 | A | 5 | 7.5 | 12.5 | 12.17 | 97.36 |
| B | 5 | 7.5 | 12.5 | 12.52 | 100.16 |
Note: API: Active Pharmaceutical Ingredient
Table 1: Accuracy data for Losartan Potassium (LP)
Precision: Precision was evaluated by two approaches. They are repeatability and intermediate precision.
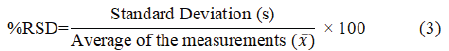
Repeatability was evaluated by repeatedly measuring the absorbance of six samples prepared at 5 ppm, 10 ppm, and 15 ppm of standard solutions of LP. The Absorbances were measured at 234 nm using deionized water as blank. Relative Standard Deviation (%RSD) was calculated using the obtained results. Equations (2) and (3) were used to calculate the Standard Deviation (SD) and the percentage of Relative Standard Deviation (%RSD).
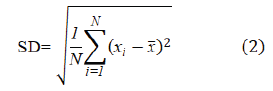
where SD is the standard deviation, N is the number of values in the data set, xi is the value of each in the data set, and x̅ is the mean of all values in the data set.
According to the ICH guidelines, %RSD of the absorbances should be ≤ 2% for a method to be accepted. Table 2shows for all three concentrations, the %RSD was below 2% and hence it can be concluded that the developed method is acceptable.
| Sample | Abs1 | Abs2 | Abs3 | Abs4 | Abs5 | Abs6 | Mean | SD | %RSD |
|---|---|---|---|---|---|---|---|---|---|
| 5 ppm | 0.226 | 0.221 | 0.227 | 0.221 | 0.226 | 0.22 | 0.224 | 0.003 | 1.406 |
| 10 ppm | 0.427 | 0.424 | 0.415 | 0.412 | 0.422 | 0.419 | 0.42 | 0.006 | 1.342 |
| 15 ppm | 0.621 | 0.618 | 0.634 | 0.621 | 0.622 | 0.615 | 0.622 | 0.006 | 1.043 |
Note: Absi=Absorbance of ith sample; SD: Standard Deviation; RSD: Relative Standard Deviation
Table 2: Repeatability data for LP
Intermediate precision was determined by measuring the absorbance values of the same concentration for three consecutive days. Three replicates from each concentration were prepared. The absorbance values for each sample on three consecutive days were then evaluated and the results are shown in Table 3.
| Concentration (ppm) | Day 1 | Day 2 | Day 3 | Mean | SD | %RSD |
|---|---|---|---|---|---|---|
| 5 | 0.224 | 0.227 | 0.224 | 0.224 | 0.00173 | 0.773 |
| 10 | 0.42 | 0.422 | 0.429 | 0.424 | 0.00473 | 1.115 |
| 15 | 0.622 | 0.623 | 0.639 | 0.628 | 0.00954 | 1.519 |
Table 3: Intermediate precision data for LP
According to Table 3, %RSD for intermediate precision values were <2% which satisfies the ICH guidelines.
Specificity: Specificity is the resolution of an analyte peak to the nearest peak. In this study, distilled water was used as the vehicle. The absorbance of the sample was measured using the distilled water as the blank. As seen in Figure 3, the resolution of the analyte peak from the rest of the ingredients was very prominent. Hence, it could be concluded that the solvent system adopted for the drug component was suitable for the study.
LOD and LOQ: The LOD represents the lowest detectable measurement of the instrument for the method, while LOQ represents the lowest concentration that the analyte is reliably detected according to predefined targets for imprecision are met. LOD and LOQ are calculated using the following equations.
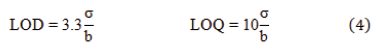
where “σ” is the residual standard deviation (or standard deviation of the y-intercept) and “b” is the slope of the calculated regression line.
For this study, LOD was 0.489 ppm while LOQ was 1.511 ppm. It is demonstrated that both values were lower than the lowest limit (i.e. 5 ppm) of the selected concentration range of this method.
Linearity: Five points calibration curve was prepared for the concentration range from 5 ppm to 15 ppm for LP. Then the linear regression equation and the correlation coefficients were determined as shown in Figure 4.

Figure 4: Calibration plot of standard LP at 234 nm
From the graph, it can be concluded that the experimental data points best fit with the linear regression with R2>0.999. Hence, the calibration plot can be used to determine unknown concentrations for the adopted range.
Range: The concentration limits which satisfy the linearity of the calibration curve were evaluated by the trial-and-error method. The two concentrations of upper and lower limit of linearity were identified as the range. As seen in Figure 4, the drug response is linearly increased with the increasing concentration of LP. Therefore, the developed method satisfied the range of 5 ppm to 15 ppm.
Stability: For stability measurements, standard samples of LP were prepared in 5 ppm, 10 ppm, and 15 ppm concentrations. The analysis was carried out by storing these samples at room temperature and in refrigerator conditions. The absorption measurements were carried out for time intervals in 24 hours (1 day), 2 days, 7 days, and 14 days after the preparation of the original standard solutions. The difference in percentage absorbance from the initial absorbance at day one (time zero), was compared with the selected time intervals. According to ICH guidelines, the percentage difference should be ± 10% with the initial concentration. As seen in Tables 4 and 5, the developed method shows stability up to 14 days at room temperature and in the refrigerator conditions as all the samples met the acceptance criteria of ± 10% deviation from the initial value. In both tables, columns 2, 4, and 6 show the absorbance values for 5 ppm, 10 ppm, and 15 ppm samples, respectively, while columns 3, 5, and 7 show the calculated percentage changes.
| Time | Abs5ppm | %Change | Abs10ppm | %Change | Abs15ppm | %Change |
|---|---|---|---|---|---|---|
| 0 | 0.227 | - | 0.428 | - | 0.646 | - |
| Day 1 | 0.228 | -0.22 | 0.438 | -1.15 | 0.643 | 0.23 |
| Day 3 | 0.227 | 0 | 0.427 | 0.12 | 0.657 | -0.84 |
| Day 7 | 0.228 | -0.22 | 0.444 | -1.83 | 0.679 | -2.49 |
| Day 14 | 0.208 | 4.37 | 0.454 | -2.95 | 0.69 | -3.29 |
Table 4: Stability determination of solutions stored at room temperature
| Time | Abs5ppm | %Change | Abs10ppm | %Change | Abs15ppm | %Change |
|---|---|---|---|---|---|---|
| 0 | 0.227 | - | 0.428 | - | 0.646 | - |
| Day 1 | 0.212 | 3.42 | 0.43 | -0.23 | 0.644 | 0.16 |
| Day 3 | 0.216 | 2.48 | 0.424 | 0.47 | 0.656 | -0.77 |
| Day 7 | 0.208 | 4.37 | 0.442 | -1.61 | 0.654 | -0.62 |
| Day 14 | 0.202 | 5.83 | 0.453 | -2.84 | 0.675 | -2.2 |
Table 5: Stability determination of solutions stored in refrigerator
Therefore, it can be concluded that the developed method can be applied for samples stored at room temperature or refrigerator conditions for up to two weeks without re-preparation of the calibration standards.
Test sample analysis
Six different brands of LP were analyzed by using a calibration plot developed as stated above. Using the calculated content of API and using equation (5), the percentage recovery was calculated.

Table 6 shows the percentage recoveries of the used market samples.
| Brand | Amount of drug present in one tablet (mg) | %Recovery |
|---|---|---|
| A | 49.82 | 99.64 |
| B | 48.77 | 97.54 |
| C | 53.85 | 107.7 |
| D | 50.67 | 101.34 |
| E | 50.24 | 100.48 |
| F | 53.26 | 106.52 |
Table 6: Test sample analysis for 50 mg LP samples
The second column of Table 6 shows the calculated amount of API according to the developed method and the amount ranges from 48.77 mg to 53.85 mg per 50 mg tablet. The last column in Table 6 shows the percentage of API determined by the developed method. It is proven that brand B contains the lowest amount of API which was 97.54% while brand C has the highest amount of active ingredient, containing 107.70%. However, all brands satisfied the acceptance criteria and are hence suitable for usage. These results demonstrate that using the developed method, a rapid determination of the concentrations of API in LP can be obtained.
Conclusion
In this study, a UV-Vis spectroscopy method was developed to determine the API concentration of Losartan Potassium (LP) in commercially available tablet samples. The method was validated according to ICH guidelines, and it was demonstrated that the developed analytical method met all the acceptance criteria. The developed method is simple, rapid, cost-effective, accurate, and precise. Moreover, the stability study has proven that the standard LP sample is stable at both the room temperature and the refrigerator condition for 14 days and hence no-repeat preparation is required for the day today sample analysis. The test sample analysis indicates that the concentration of LP can be found directly using the UV-visible spectrophotometer. Conclusively, the developed analytical method can be used for quantitative analysis for market samples of LP.
References
- World Health Organization. World Health Organization model list of essential medicines for children: 7th list 2019. World Health Organization. 2019.
- Bonfilio R, Favoretto LB, Pereira GR, Azevedo RD, Araújo MB. Comparative study of analytical methods by direct and first-derivative UV spectrophotometry for evaluation of losartan potassium in capsules. Brazilian J Pharm Sci. 2010; 46: 147-155.
[CrossRef ] [Google Scholar]
- Ripley E, Hirsch A. Fifteen years of losartan: What have we learned about losartan that can benefit chronic kidney disease patients? Int J Nephrol Renovasc Dis. 2010; 3: 93.
[CrossRef ] [Google Scholar] [Pubmed ]
- Costagliola C, Verolino M, de Rosa ML, Laccarino G, Ciancaglini M, Mastropasqua L. Effect of oral losartan potassium administration on intraocular pressure in normotensive and glaucomatous human subjects. Exp Eye Res. 2000; 71(2): 167-171.
[CrossRef ] [Google Scholar] [Pubmed ]
- Brenner BM, Cooper ME, de Zeeuw D, Keane WF, Mitch WE, Parving HH, et al. Effects of losartan on renal and cardiovascular outcomes in patients with type 2 diabetes and nephropathy. N Engl J Med. 2001; 345(12): 861-869.
[CrossRef ] [Google Scholar] [Pubmed ]
- Ashraf Z, Waheed N, Naz E, Ahmed F, Asim T, Muzammil F, et al. Assay for Quantitative Analysis of Losartan Potassium by using UV Spectroscopy. Glob J Med Res. 2015; 15.
- Goa KL, Wagstaff AJ. Losartan Potassium: A review of its pharmacology, clinical efficacy and tolerability in the management of hypertension. Drugs. 1996; 51(5): 820-845.
[CrossRef ] [Google Scholar] [Pubmed ]
- Williams RC, Alasandro MS, Fasone VL, Boucher RJ, Edwards JF. Comparison of liquid chromatography, capillary electrophoresis and super-critical fluid chromatography in the determination of Losartan Potassium drug substance in Cozaar® tablets. J Pharm Biomed Anal. 1996; 14(11): 1539-1546.
[CrossRef ] [Google Scholar] [Pubmed ]
- Soldner A, Spahn-Langguth H, Mutschler E. HPLC assays to simultaneously determine the angiotensin-AT1 antagonist losartan as well as its main and active metabolite EXP 3174 in biological material of humans and rats. J Pharm Biomed Anal. 1998; 16(5): 863-873.
[CrossRef ] [Google Scholar] [Pubmed ]
- Lastra OC, Lemus IG, Sánchez HJ, Pérez RF. Development and validation of an UV derivative spectrophotometric determination of losartan potassium in tablets. J Pharm Biomed Anal. 2003; 33(2): 175-180.
[CrossRef ] [Google Scholar] [Pubmed ]
- de Oliveira RP, Felix FS, Angnes L. A simple and precise conductometric method for the determination of losartan in pharmaceutical products. Cent Eur J Chem. 2012; 10(6): 1842-1849.
[CrossRef ] [Google Scholar]
- Stolarczyk M, Maślanka A, Apola A, Krzek J. Determination of losartan potassium, quinapril hydrochloride and hydrochlorothiazide in pharmaceutical preparations using derivative spectrophotometry and chromatographic-densitometric method. Acta Pol Pharm. 2013; 70(6).
[Google Scholar] [Pubmed ]
- Lusina M, Cindrić T, Tomaić J, Peko M, Pozaić L, Musulin N. Stability study of losartan/hydrochlorothiazide tablets. Int J Pharm. 2005; 291(1-2): 127-137.
[CrossRef ] [Google Scholar] [Pubmed ]
- Jayasundara UK, Herath HMMB, Kaushalya PVN. Method development, validation,and concentration determination of metformin hydrochloride and atorvastatin calsium using UV-Visible spectrophotometry. J Anal Bioanal Tech. 2021; 12(2: 1-7.
- Kameyama Y, Matsuhama M, Mizumaru C, Saito R, Ando T, Miyazaki S. Comparative study of pharmacopoeias in Japan, Europe, and the United States: Toward the further convergence of international pharmacopoeial standards. Chem Pharm Bull. 2019; 67(12): 1301-1313.
[CrossRef ] [Google Scholar] [Pubmed ]
- Borman P, Elder D. Q2 (R1) validation of analytical procedures. ICH Quality Guidelines. 2017; 5: 127-166.
- Tijare LK, Rangari NT, Mahajan UN. A review on bioanalytical method development and validation. Asian J Pharm Clin Res. 2016; 9(3): 6-10.
[CrossRef ] [Google Scholar]
- Salomi P, Nayak DM, Vimalakannan T, Reddy KR. Method development and method validation of guaifenesin and dextromethorphan by RP-HPLC. Int J Res Pharm Chem Anal. 2018; 1(1): 18-24.
[CrossRef ] [Google Scholar] [Pubmed ]
- Siddiqui MR, AlOthman ZA, Rahman N. Analytical techniques in pharmaceutical analysis: A review. Arab J Chem. 2017; 10: 1409-1421.
[CrossRef ] [Google Scholar]
Author Info
Maneesha C Abeysekera, Muditha B Herath, Shehani H Basnagoda and Udaya K Jayasundara*Citation: Abeysekera MC: Development, Validation, and Concentration Determination of Losartan Potassium Using 1D UV Visible Spectrophotometry
Received: 07-Feb-2022 Accepted: 21-Feb-2022 Published: 28-Feb-2022, DOI: 10.31858/0975-8453.13.2.116-121
Copyright: This is an open access article distributed under the terms of the Creative Commons Attribution License, which permits unrestricted use, distribution, and reproduction in any medium, provided the original work is properly cited.
ARTICLE TOOLS
 Abstract
- Dental Development between Assisted Reproductive Therapy (Art) and Natural Conceived Children: A Comparative Pilot Study Norzaiti Mohd Kenali, Naimah Hasanah Mohd Fathil, Norbasyirah Bohari, Ahmad Faisal Ismail, Roszaman Ramli SRP. 2020; 11(1): 01-06 » doi: 10.5530/srp.2020.1.01
- Psychometric properties of the World Health Organization Quality of life instrument, short form: Validity in the Vietnamese healthcare context Trung Quang Vo*, Bao Tran Thuy Tran, Ngan Thuy Nguyen, Tram ThiHuyen Nguyen, Thuy Phan Chung Tran SRP. 2020; 11(1): 14-22 » doi: 10.5530/srp.2019.1.3
- A Review of Pharmacoeconomics: the key to “Healthcare for All” Hasamnis AA, Patil SS, Shaik Imam, Narendiran K SRP. 2019; 10(1): s40-s42 » doi: 10.5530/srp.2019.1s.21
- Deuterium Depleted Water as an Adjuvant in Treatment of Cancer Anton Syroeshkin, Olga Levitskaya, Elena Uspenskaya, Tatiana Pleteneva, Daria Romaykina, Daria Ermakova SRP. 2019; 10(1): 112-117 » doi: 10.5530/srp.2019.1.19
- Dental Development between Assisted Reproductive Therapy (Art) and Natural Conceived Children: A Comparative Pilot Study Norzaiti Mohd Kenali, Naimah Hasanah Mohd Fathil, Norbasyirah Bohari, Ahmad Faisal Ismail, Roszaman Ramli SRP. 2020; 11(1): 01-06 » doi: 10.5530/srp.2020.1.01
- Manilkara zapota (L.) Royen Fruit Peel: A Phytochemical and Pharmacological Review Karle Pravin P, Dhawale Shashikant C SRP. 2019; 10(1): 11-14 » doi: 0.5530/srp.2019.1.2
- Pharmacognostic and Phytopharmacological Overview on Bombax ceiba Pankaj Haribhau Chaudhary, Mukund Ganeshrao Tawar SRP. 2019; 10(1): 20-25 » doi: 10.5530/srp.2019.1.4
- A Review of Pharmacoeconomics: the key to “Healthcare for All” Hasamnis AA, Patil SS, Shaik Imam, Narendiran K SRP. 2019; 10(1): s40-s42 » doi: 10.5530/srp.2019.1s.21
- A Prospective Review on Phyto-Pharmacological Aspects of Andrographis paniculata Govindraj Akilandeswari, Arumugam Vijaya Anand, Palanisamy Sampathkumar, Puthamohan Vinayaga Moorthi, Basavaraju Preethi SRP. 2019; 10(1): 15-19 » doi: 10.5530/srp.2019.1.3