Research Article - (2022) Volume 13, Issue 3
Ficus thonningii Stem Bark Extracts Prevent High Fructose Diet Induced Increased Plasma Triglyceride Concentration, Hepatic Steatosis and Inflammation in Growing Sprague-Dawley Rats
Eliton Chivandi1*, Yvonne Mhosva1, Trevor Nyakudya2 and Pilani Nkomozepi3Abstract
Background: Ficus thonningii extracts exhibit hypoglycaemic, hypolipidaemic and antioxidant activitiese investigated the potential of methanolic F. thonningii stem-bark extracts (MEFT) to protect growing Sprague-Dawley (SD) against high-fructose diet-induced Metabolic Derangements (MD) in a model mimicking childreenic diets.
Methods: Eighty (40 males; 40 females) 21-days old SD rat pups were randomly allocated to and administered, for 8 weeks, five treatment regimens: 1-standard rat chow (SC)+water (PW), 2-SC+20% (w/v) fructose solution (FS), 3-SC+FS+fenofibrate at 100 mg/kg bwt/ day, 4-SC+FS+low dose MEFT (LD; 50 mg/kg bwt/day) and 5-SC+FS+high dose MEFT (HD; 500 mg/kg bwt/ day). Body weight, glucose load tolerance, fasting blood glucose and triglyceride, plasma insulin concentration, sensitivity to insulin, liver mass and fat content, steatosis and inflammation were determined.
Results: Fructose had no effect on the rats’ growth, glucose and insulin concentration, glucose tolerance and insulin sensitivity (P>0.05) but increased triglycerides in females; induced hepatic microsteatosis and inflammation in both sexes but macrosteatosis in females (P<0.05). In females, MEFT prevented fructose- induced plasma triglyceride increase. Low dose MEFT increased liver lipid content in females (P<0.05). The MEFT protected the rats against hepatic steatosis and inflammation but fenofibrate protected against hepatic microsteatosis.
Conclusion: MEFT can d as prxis against dietary fructose-induced elements of MD but caution musaken as low dose MEFT increases hepatic lipid acc in females predisposing to fatty liver disease.
Keywords
F. thonningii, Ethnomedicine, Obesity, Lipid profile, Liver disease
Introduction
Obesia global public health concern with 13% of the ghuman adult population and 340 million children obese (World Health Organisation, 2018). In sub-Saharan Africa (SSA) 10.6% of the children are obese (Muthuri SK, et al., 2014) and in South Africa 13% of them are obese (Pienaar AE, 2015). Epigenetics contribute to obesity but lack and inadequate exercise and intake of obesogenic diets increases the development of obesity (Sekgala MD, et al., 2018). The risk of developing dyslipidaemia (Zhang YI, et al., 2014), insulin resistance, non-alcoholic fatty liver diseases (Jensen VS, et al., 2018), metabolic syndrome (Matsuzawa Y, 2014) and type II diabetes (Jensen, et al., 2018) is increased in obese individuals.
Metformin is used to manage type II diabetes mellitus and fenofibrate is used to manage dyslipidaemia associated with metabolic syndrome (Kraja A, et al., 2010; Li XM, et al., 2011). These conventional pharmacological agents are monotherapeutic, relatively expensive, inaccessible to the majority global population and elicit side effects (Rodgers RJ, et al., 2012) hence the dire need for less costly, more accessible and less toxic alternatives. Majority of the global population makes use of plant-derived ethnomedicines (Amiot MJ, et al., 2016). Eighty percent of the SSA population (World Health Organisation, 2018) and 27 million South Africans depend on plant-derived ethnomedicines for health care (Oyebode O, et al., 2016). Research on efficacy and safety of these alternative medicines is critical to increasing access to global primary health care. Ficus thonningii is an ethnomedicine used to treat a number of conditions (Teklehaymanot T and Giday M, 2007). Its parts and extracts contain tannins, saponins and flavonoids (Egharevba HO, et al., 2015) with antiobesity, antioxidant and antidiabetic activities (Fitrilia T, et al., 2015) making it a potential prophylactic agent against diet-induced metabolic derangements (MDs). We evaluated the prophylactic potential of crude methanolic F. thonningii stembark extracts to protect against dietary fructose-induced MDs in growing Sprague-Dawley rats mimicking children fed obesogenic diets.
Materials and Methods
collection, identification and extract preparation
Fresh F. thonningii stem bark was collected at a farm (GPS: Longitude 20° 13' 47" and latitude 28° 45' 9") in Bulawayo, Zimbabwe. The stem barks and samples of the tree’s small branches were transported overnight to the University of the Witwatersrand, South Africa where John Burrows, a nature conservationist, identified and authenticated the plant.
Cut strips of F. thonningii stem barks were dried in an oven at 40°C for 24 hours and then milled into a fine powder. The stem bark extract was prepared as described by Musabayane CT, et al., 2007. . (Musabayane CT et al., 2007). Briefly, 25 g of the powder were macerated in 100 mL of 80% methanol (Merck Chemicals, Johannesburg South Africa) for 24 hours with continuous stirring. Immediately thereafter the mixture was filtered using a filter paper (Whattman®, No 1, size 185 mm, pore size 7-11 μm). The filtrate was rotor-evaporator concentrated at 60°C and then dried in an oven at 40°C for 12 hours. The dried extract was stored at 4°C in sealed glass bottles until use.
Study site and ethical clearance
The study, approved by the Animal Ethical Screening Committee of Wits University (AESC number: 2016/05/24/C), was conducted within Wits Research Animal Facility and School of Physiology of Wits University. Handling and procedures on the rats were as per international guidelines on animal use in research.
Rat management
Eighty 21-day olds SD rat pups used were given a 2-day habituation period to familiarize with handling and the experimental environment. Each rat was individually housed in an acrylic cage with a feeding trough and a drinker. Bedding from clean wood shavings was changed twice weekly. Room temperature was maintained at 24 ± 2°C. A light/dark cycle conjuncture maintained: maintained: Lights on from 0700 to 1900 hours. A standard rat chow (Epol RCL Food, Centurion, South Africa) and drinking fluid: Tap water and 20% (w/v) fructose solution, depending on treatment, were availed ad libitum.
Study design
Eighty 21-days old SD rat pups (40 males; 40 females) were randomly allocated to and administered, for 8 weeks, five treatment regimens: 1-standard rat chow (SRC)+water (W), 2-SRC+20% (w/v) fructose solution (FS), 3-SRC+FS+fenofibrate at 100 mg/kg bwt/day (FEN), 4-SRC+FS+lo MEFT (LD; 50 mg/kg bwt/day) and 5-SRC+FS+high dose MEFT (HD; 500 mg/kg bwt/day). Gelatine cubes, vehicles for the administration of F. thonningii extract and fenofibrate, were prepared as described by Kamerman (Kamerman PR, et al., 2004). In order to maintain a constant fenofibrate and F. thonningii extract dose and assess growth, the rats were weighed twice per week.
Oral glucose tolerance test
Following 54 days on treatments (post-natal day 77), the rats were subjected to an Oral Glucose Tolerance Test (OGTT) following an overnight fast but with ad libitum access to drinking water. A Contour-plus glucometer was used to determine the fasting blood glucose concentration with blood from a pin-prick of each rat’s tail vein (Loxham SJG, et al., 2007). Immediately thereafter, each rat was gavaged with 2 g/kg body weight of sterile 50% (w/v) D-glucose (Sigma, Johannesburg, South Africa) solution. Post-gavage blood glucose concentrations were measured at 15, 30, 60 and 120 minutes.
Terminal procedures and measurements
After a 48-hour recovery from the OGTT on their respective treatments, the rats were again fasted for 12-hours. Fasting blood glucose and triglyceride concentrations were measured using a calibrated Contour Plus® glucometer and an Accutrend GCT meter. Each rat was then euthanised by intraperitoneal injection of 200 mg/kg bwt sodium-pentobarbitone (Euthanaze, Centaur labs, Johannesburg, South Africa). Each rat’s blood, collected into heparinised blood collection tubes via cardiac puncture was then centrifuged for 10 min at 5000 × g. Plasma was decanted into microtubes and stored at -20°C pending assay for plasma insulin concentration. Livers were dissected out, each weighed, and a sample preserved in 10% phosphate-buffered formalin and the remainder was frozen-stored at -20°C for liver lipid content determination.
Insulin determination and estimation of insulin resistance
An ELISA (ElabScience Biotechnology, Texas, USA) kit with monoclonal insulin antibodies specific for rat insulin, was used to determine plasma insulin concentration. Absorbencies were read 450 nm off a plate reader (Multiskan Ascent, Lab System Model354, Helsinki, Finland). Insulin concentrations were determined from the constructed standard curve. Fasting blood glucose and plasma insulin data were used to compute fasting whole-body insulin sensitivity and the β-cell function using the homeostasis model assessment of insulin resistance as follows: HOMA-IR=fasting plasma glucose (mg/dL) × fasting plasma insulin (μU/mL)]/405 (Matthews DR, et al., 1985).
Liver lipid content and histology
Liver lipid content was determined as described by the Association of Analytical Chemists (Horwitz W and Latimer GW, 2005) 20 using a Tecator Soxtec apparatus. Assays were done in triplicate. The formalin-preserved liver samples were processed in an automatic tissue processor (Microm STP 120 Thermoscientiassachusetts, USA), embedded in paraffin wax, rotary microtome-sectioned (RM 2125 RT, Leica Biosystems, Germany) at 3 μm, mounted on glass slides and then haematoxylin and eosin stained. A Leica ICC50 HD video-camera linked to a Leica DM 500 microscope (Leica, Wetzlar, Germany) captured photomicrographs of stained sections that were analysed using ImageJ software. Stained liver sections were scored semi-quantitatively for macro-/micro-steatosis and inflammation according to Liang (Liang W, et al., 2014). Hepatocellular vesicular micro-/macro-steatosis were analyzed based on the total area of the liver parenchyma affected per camera field (× 20) and scored according to the criteria: Grade 0=˂5%; grade 1=5-33%, grade 2=33-66% and grade 3=>66%. The number of inflammatory cell aggregates in the liver parenchyma were counted per camera field (× 100) and scored as follows: Grade 0=none or no foci per camera field; grade 1=0.5 to 1.0 foci per camera field, camera field; grade 2=1-2 foci per camera field; grade 3 ≥ 2 foci per camera field (×100).
Statistical analysis
Parametric data is presented as mean ± SD and non-parametric data as median and interquartile ranges. GraphPad Prism 6.0 (Graph Pad Software, San Diego, California, USA) was used to analyse data. A repeated measures ANOVA was used to analyse OGTT data. Other parametric data was analyzed using a one-way ANOVA and mean comparisons done via Bonferroni post hoc test. Kruskal-Wallis test was used to analyse scores for macro-/micro-steatosis and inflammation. Medians of non-parametric data were compared using the Dunns post hoc test. Significance was set at P<0.05.
Results
Growth performance and tolerance of an oral glucose load
Figures 1A and 1B show the induction and terminal body masses of the male and female rats, respectively. The induction body weights of the male rats and female rats (Figures 1a and 1b), respectively, were similar. Treatment regimens had no effect (P>0.05) on the rats’ terminal body masses but the rats grew significantly during the trial (P<0.05).
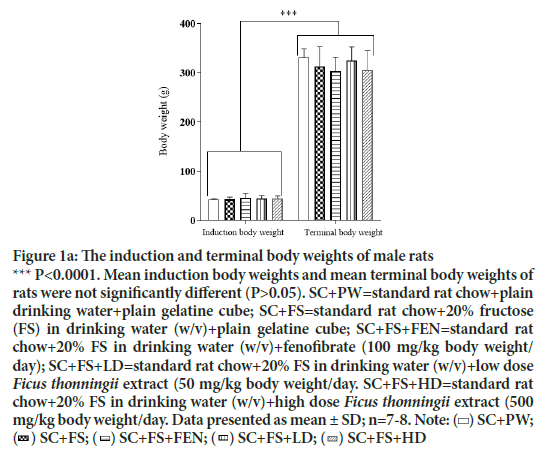
Figure 1a: The induction and terminal body weights of male rats
*** P<0.0001. Mean induction body weights and mean terminal body weights of rats were not significantly different (P>0.05). SC+PW=standard rat chow+plain drinking water+plain gelatine cube; SC+FS=standard rat chow+20% fructose (FS) in drinking water (w/v)+plain gelatine cube; SC+FS+FEN=standard rat chow+20% FS in drinking water (w/v)+fenofibrate (100 mg/kg body weight/
day); SC+FS+LD=standard rat chow+20% FS in drinking water (w/v)+low dose Ficus thonningii extract (50 mg/kg body weight/day. SC+FS+HD=standard rat chow+20% FS in drinking water (w/v)+high dose Ficus thonningii extract (500 
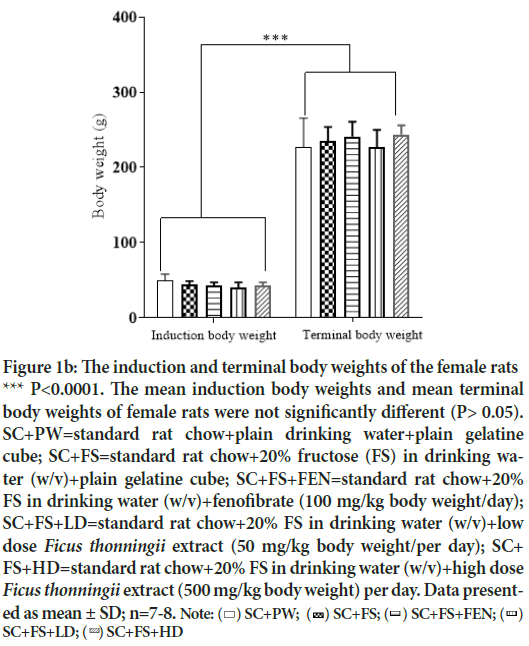
Figure 1b: The induction and terminal body weights of the female rats
*** P<0.0001. The mean induction body weights and mean terminal body weights of female rats were not significantly different (P> 0.05). SC+PW=standard rat chow+plain drinking water+plain gelatine cube; SC+FS=standard rat chow+20% fructose (FS) in drinking water (w/v)+plain gelatine cube; SC+FS+FEN=standard rat chow+20% FS in drinking water (w/v)+fenofibrate (100 mg/kg body weight/day); SC+FS+LD=standard rat chow+20% FS in drinking water (w/v)+low dose Ficus thonningii extract (50 mg/kg body weight/per day); SC+ FS+HD=standard rat chow+20% FS in drinking water (w/v)+high dose Ficus thonningii extract (500 mg/kg body weight) per day. Data present
Figures 2a and 2b show the area under the curve for male and female rats, respectively, calculated from the OGGT data. Treatment regimens had no effect (P>0.05) on tolerance to an oral glucose load.
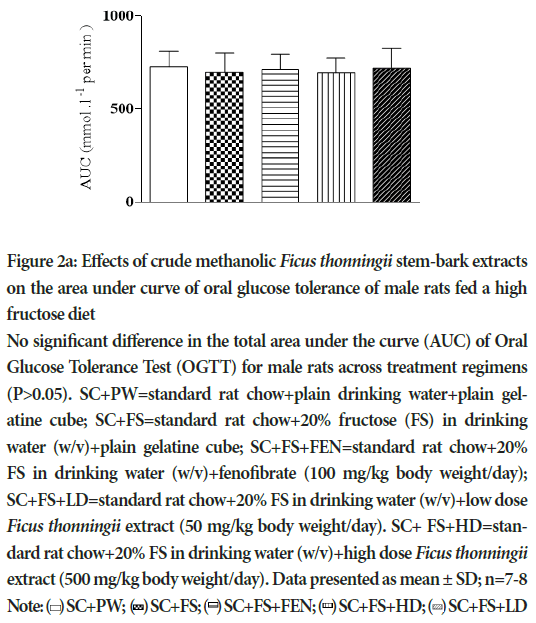
Figure 2a: Effects of crude methanolic Ficus thonningii stem-bark extracts on the area under curve of oral glucose tolerance of male rats fed a high fructose diet
No significant difference in the total area under the curve (AUC) of Oral Glucose Tolerance Test (OGTT) for male rats across treatment regimens (P>0.05). SC+PW=standard rat chow+plain drinking water+plain gelatine cube; SC+FS=standard rat chow+20% fructose (FS) in drinking water (w/v)+plain gelatine cube; SC+FS+FEN=standard rat chow+20% FS in drinking water (w/v)+fenofibrate (100 mg/kg body weight/day); SC+FS+LD=standard rat chow+20% FS in drinking water (w/v)+low dose Ficus thonningii extract (50 mg/kg body weight/day). SC+ FS+HD=standard rat chow+20% FS in drinking water (w/v)+high dose Ficus thonningii extract (500 mg/kg body weight/day). Data presented as mean ± SD; n=7-8
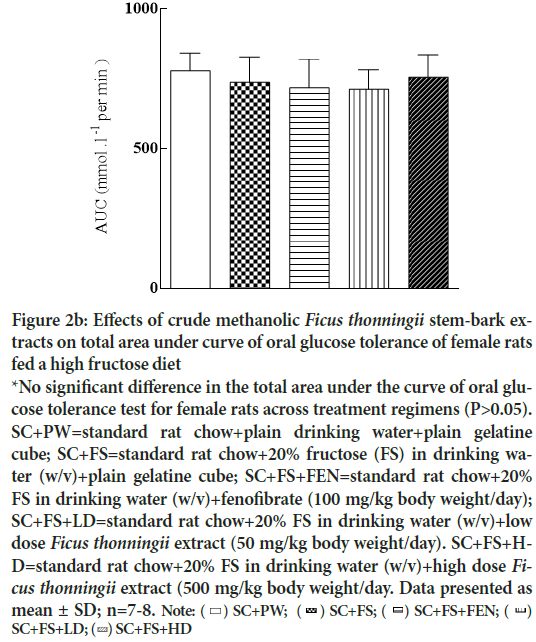
Figure 2b: Effects of crude methanolic Ficus thonningii stem-bark extracts on total area under curve of oral glucose tolerance of female rats fed a high fructose diet
*No significant difference in the total area under the curve of oral glucose tolerance test for female rats across treatment regimens (P>0.05). SC+PW=standard rat chow+plain drinking water+plain gelatine cube; SC+FS=standard rat chow+20% fructose (FS) in drinking water (w/v)+plain gelatine cube; SC+FS+FEN=standard rat chow+20% FS in drinking water (w/v)+fenofibrate (100 mg/kg body weight/day); SC+FS+LD=standard rat chow+20% FS in drinking water (w/v)+low dose Ficus thonningii extract (50 mg/kg body weight/day). SC+FS+HD=
standard rat chow+20% FS in drinking water (w/v)+high dose Ficus thonningii extract (500 mg/kg body weight/day. Data presented as 
Circulating metabolites concentration and insulin sensitivity
Effects of the methanolic F. tgii stem bark extracts on blood glucose and triglyceride and plasma insulin concentrations and HOMA-IR of the male and female rats are shown in tables 1a and 1b, respec. The triglyceride, glucose and insulin concentrations and HOMA-IR index of male rats across treatment regimens was similar (P>0.05). In females blood glucose and plasma insulin concentration and HOMA-IR index of the rats were similar (P˃0.05) across treatments but females administered a high fructose diet alone had higher (P<0.05) plasma triglyceride concentration than rats fed the control diet.
| Parameter | SC+PW | SC+FS | SC+FS+FEN | SC+FS+LD | SC+FS+HD | Significance |
|---|---|---|---|---|---|---|
| Triglyceride (mmol/L) | 1.38 ± 0.61a | 1.9 ± 0.93a | 1.51 ± 0.55a | 1.39 ± 0.36a | 1.39 ± 0.24a | ns |
| Glucose (mmol/L) | 4.54 ± 0.77a | 4.26 ± 0.64a | 4.49 ± 0.54a | 3.93 ± 0.41a | 4.26 ± 0.57a | ns |
| Insulin (μg/L) | 38.68 ± 29.2a | 37.02 ± 20.9a | 31.42 ± 18.99a | 29.02 ± 21.7a | 29.59 ± 13.68a | ns |
| HOMA-IR | 7.73 ± 5.60a | 6.82 ± 3.69a | 5.99 ± 3.57a | 5.21 ± 4.13a | 5.40 ± 2.61a | ns |
Note: Where ns: not significant; P>0.05
Rats’ mean triglyceride, glucose and insulin concentrations and HOMA-IR indices were similar across treatment regimens. SC+PW=standard rat
chow+plain drinking water+plain gelatine cube; SC+FS=standard rat chow+20% fructose (FS) in drinking water (w/v)+plain gelatine cube
Table 1a: Effects of crude methanolic Ficus thonningii stem-bark extracts on blood triglyceride, glucose and insulin concentration and HOMA-IR index of male rats fed a high-fructose diet
| Parameter | SC+PW | SC+FS | SC+FS+FEN | SC+FS+LD | SC+FS+HD | Significance |
|---|---|---|---|---|---|---|
| Triglyceride (mmol/L) | 1.48 ± 027a | 2.04 ± 0.33b | 1.60 ± 0.25ab | 1.60 ± 0.35ab | 1.43 ± 0.34ac | * |
| Glucose (mmol/L) | 4.26 ± 0.64a | 4.24 ± 0.48a | 4.49 ± 0.54a | 3.94 ± 0.46a | 4.34 ± 0.72a | ns |
| Insulin (μg/L) | 27.85 ± 13.47a | 28.01 ± 19.27a | 24.67 ± 18.65a | 22.71 ± 15.77a | 37.57 ± 20.6a | ns |
| HOMA-IR | 5.07 ± 3.34a | 5.09 ± 3.32a | 4.85 ± 3.51a | 4.52 ± 3.25a | 7.09 ± 3.35a | ns |
Note: Where ns: not significant; P>0.05; *P<0.05; abc: Within row means with different superscripts are significantly different (P<0.05) Rats fed a high fructose diet alone had significantly higher blood triglyceride concentration compared to control rats (P<0.05). Rats fed a high fructose diet with a high dose of F.thonningii as an intervention had significantly lower blood triglyceride concentration P(<0.05) compared to that of rats fed a high fructose diet alone. SC+PW=standard rat chow+plain drinking water+plain gelatine cube; SC+FS=standard rat chow+20% fructose (FS) in drinking water (w/v)+plain gelatine cube; SC+FS+FEN=standard rat chow+20% FS in drinking water (w/v)+fenofibrate (100 mg/kg body mass/day); SC+FS+LD=standard rat chow+20% FS in drinking water (w/v)+low dose Ficus thonningii extract (50 mg/kg body mass/day). SC+FS+HD=standard rat chow+20% FS in drinking water (w/v)+high dose Ficus thonningii extract (500 mg/kg body mass/day). Data presented as mean ± SD; n=7-8
Table 1b: Effects of crude methanolic Ficus thonningii stem-bark extracts on blood triglyceride, glucose and insulin concentration and HOMA-IR index of female rats fed a high-fructose diet
Liver lipid content and liver macro-/micro-morphometry
Figures 3a and 3b show the effects of crude methanolic F. thonningii stem- bark extracts (MEFT) on the hepatic lipid content of male and females rats, respectively, fed a high-fructose diet. Hepatic lipid content of male rats was similar across treatment regimens. Female rats fed a high fructose diet and the low dose of the crude MEFT had significantly more hepatic lipid compared to that of rats administered other treatments (P<0.001). (Figures 2a and 2b) show the effects of crude MEFT on the liver weights, hepatic steatosis and hepatic inflammation of male and female rats, respectively, fed a high-fructose diet. Male rats fed the high fructose diet had higher hepatic micro-steatosis and inflammation scores compared to control (P<0.05). Relative to body mass, fenofibrate caused heavier livers in both male and female rats but elicited hepatic inflammation only in males (P<0.05). The low and high dose MEFT prevented the fructose-induced hepatic micro-steatosis and inflammation. Fenofibrate prevented microsteatosis in males (Figure 4a and Table 2a). Dietary fructose induced macro- and micro-steatosis and hepatic inflammation (P<0.05) in female rats which were prevented by both MEFT doses but not fenofibrate (Figure 4b and Table 2b).
| Parameters | SC+PW | SC+FS | SC+FS+FEN | SC+FS+LD | SC+FS+HD | Significance |
|---|---|---|---|---|---|---|
| Liver (g) | 11.10 ± 1.20a | 10.50 ± 0.98a | 13.30 ± 3.09a | 12.00 ± 3.06a | 12.00 ± 3.06a | ns |
| Liver (% bwt) | 3.35 ± 0.34ab | 2.56 ± 1.49a | 4.44 ± 1.23b | 3.50 ± 0.51ab | 3.47 ± 0.33ab | ** |
| Liver (rTL g/mm) | 27.50 ± 3.16a | 25.50 ± 2.37a | 34.10 ± 7.90a | 30.2 ± 7.43a | 27 ± 4.84a | ns |
| Macrosteatosis | 0(0;0)ᵃ | 0(0;0)ᵃ | 0(0;0)ᵃ | 0(0;0)ᵃ | 0(0;0)ᵃ | ns |
| Microsteatosis | 0(1;0)ᵃ | 1(2;1)ᵇ | 0.5(1;0)ᵃ | 0.5(1;0)ᵃ | 0.5(1;0)ᵃ | * |
| Inflammation | 0(1;0)ᵃ | 1(1;0)ᵇ | 1(1;0)ᵇ | 0(1:0)ᵃ | 0(1;0)ᵃ | * |
Note: ns: not significant, P>0.05; *P ≤ 0.05; **P<0.01; ab: Within row means with different superscripts are significantly different at P<0.05).
Rats fed a high fructose diet with fenofibrate had significantly heavier livers compared to the rats fed the control diet (P<0.01). Rats fed a high fructose
diet alone had a significantly higher (P<0.05) micro-steatosis score compared to the rats in other treatment regimens. Rats fed a high fructose diet and
those fed a high fructose diet with fenofibrate as an intervention had significantly higher (P<0.05) hepatic inflammation scores than their counterparts administered other treatment regimens. SC+PW=standard rat chow+plain drinking water+plain gelatine cube; SC+FS=standard rat chow+20%
fructose (FS) in drinking water (w/v)+plain gelatine cube; SC+FS+FEN=standard rat chow+20% FS in drinking water (w/v)+fenofibrate (100 mg/kg
body weight/day); SC+FS+LD=standard rat chow+20% FS in drinking water (w/v)+low dose Ficus thonningii extract (50 mg/kg body weight/day).
SC+FS+HD=standard rat chow+20% FS in drinking water (w/v)+high dose Ficus thonningii extract (500 mg/kg body weight/day). Data presented as
mean ± SD, median and IQR; n=7-8
Table 2a: Effect of crude methanolic Ficus thonningii stem-bark extract on the macro- and micro-morphometry of the liver from male rats fed a high-fructose diet
| Parameters | SC+PW | SC+FS | SC+FS+FEN | SC+FS+LD | SC+FS+HD | Significance |
|---|---|---|---|---|---|---|
| Liver (g) | 7.35 ± 2.12a | 8.07 ± 2.03a | 9.73 ± 1.74a | 8.02 ± 1.39a | 8.54 ± 1.58a | ns |
| Liver (% bwt) | 3.19 ± 0.39a | 3.4 ± 0.60a | 4.02 ± 0.49b | 3.52 ± 0.39ab | 3.50 ± 0.59ab | * |
| Liver (rTL g/mm) | 18.90 ± 5.80a | 21.50 ± 5.36a | 26.00 ± 3.85a | 21.60 ± 4.22a | 24.00 ± 3.94a | ns |
| Macrosteatosis | 0(0;0)ᵃ | 2.5(3.0; 2.0)ᵇ | 0(0;0)ᵃ | 0(0;0)ᵃ | 0(0;0)ᵃ | *** |
| Microsteatosis | 0(1;0)ᵃ | 2(3;1)ᵇ | 1(2;1)ᵃ | 0.5(1;0)ᵃ | 0(0;0)ᵃ | * |
| Inflammation | 0(0;0)ᵃ | 1(1;0)ᵇ | 0(1;0)ᵃᵇ | 0(0:0)ᵃ | 0(0;0)ᵃ | ** |
Note: Ins: not significant; P>0.05; *P<0.05. **P<0.01; ab: Within row means with different superscripts are significantly different at P<0.05.
Rats fed a high fructose diet with fenofibrate had significantly heavier livers) compared to the rats fed the control diet (P<0.01). Rats fed a high fructose
diet had significantly higher steatosis scores compared to rats fed a control diet or a high fructose diet with fenofibrate or F. thonningii extracts (P<0.05).
SC+PW=standard rat chow+plain drinking water+plain gelatine cube; SC+FS=standard rat chow+20% fructose (FS) in drinking water (w/v)+plain
gelatine cube; SC+FS+FEN=standard rat chow+20% FS in drinking water (w/v)+fenofibrate (100 mg/kg body weight/day); SC+FS+LD=standard rat
chow+20% FS in drinking water (w/v)+low dose F. thonningii extract (50 mg/kg body weight/day). SC+FS+HD=standard rat chow+20% FS in drinking water (w/v)+high dose F. thonningii extract (500 mg/kg body weight/day). Data presented as mean ± SD, median and IQR; n=7-8
Table 2b: Effect of crude methanolic Ficus thonningii stem-bark extract on the macro-and micro-morphometry of the liver from female rats fed a high-fructose diet
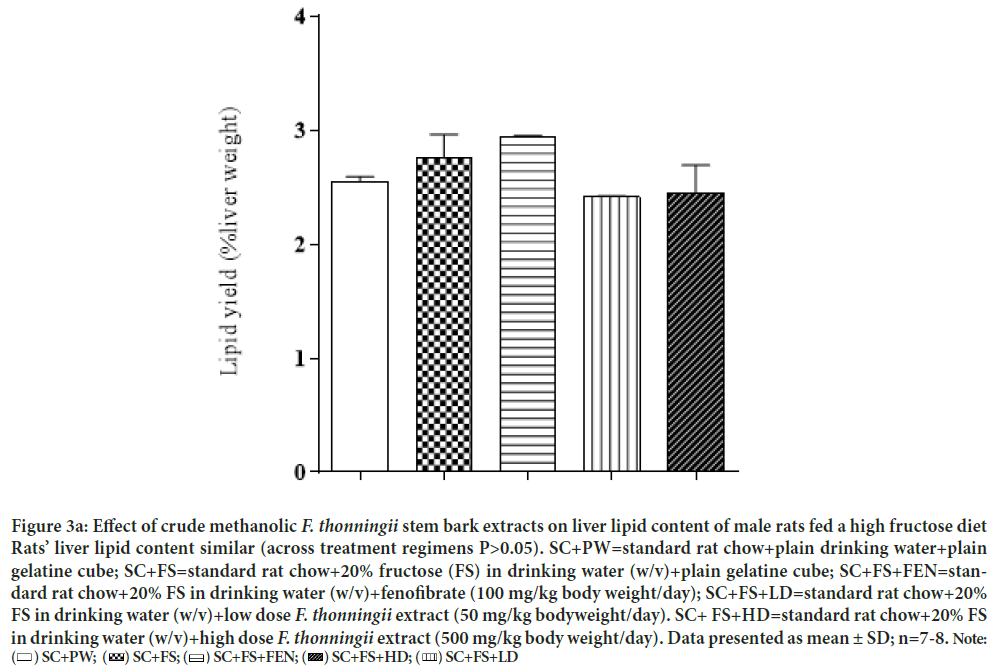
Figure 3a: Effect of crude methanolic F. thonningii stem bark extracts on liver lipid content of male rats fed a high fructose diet
Rats’ liver lipid content similar (across treatment regimens P>0.05). SC+PW=standard rat chow+plain drinking water+plain
gelatine cube; SC+FS=standard rat chow+20% fructose (FS) in drinking water (w/v)+plain gelatine cube; SC+FS+FEN=standard rat chow+20% FS in drinking water (w/v)+fenofibrate (100 mg/kg body weight/day); SC+FS+LD=standard rat chow+20%
FS in drinking water (w/v)+low dose F. thonningii extract (50 mg/kg bodyweight/day). SC+ FS+HD=standard rat chow+20% FS
in drinking water (w/v)+high dose F. thonningii extract (500 mg/kg body weight/day). Data presented as mean ± SD; n=7-8. Note: 
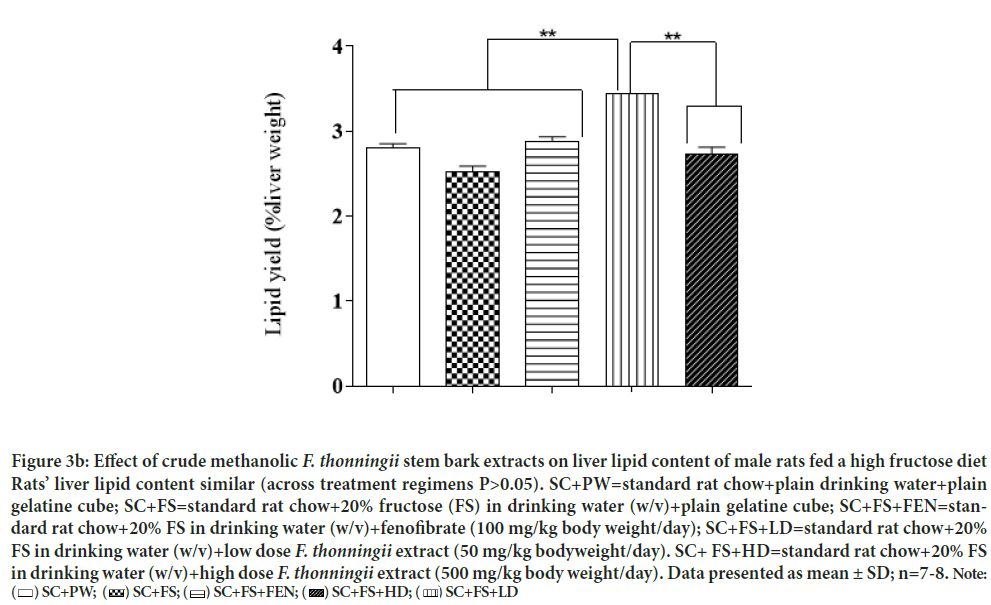
Figure 3b: Effect of crude methanolic F. thonningii stem bark extracts on liver lipid content of male rats fed a high fructose diet
Rats’ liver lipid content similar (across treatment regimens P>0.05). SC+PW=standard rat chow+plain drinking water+plain
gelatine cube; SC+FS=standard rat chow+20% fructose (FS) in drinking water (w/v)+plain gelatine cube; SC+FS+FEN=standard rat chow+20% FS in drinking water (w/v)+fenofibrate (100 mg/kg body weight/day); SC+FS+LD=standard rat chow+20%
FS in drinking water (w/v)+low dose F. thonningii extract (50 mg/kg bodyweight/day). SC+ FS+HD=standard rat chow+20% FS
in drinking water (w/v)+high dose F. thonningii extract (500 mg/kg body weight/day). Data presented as mean ± SD; n=7-8. Note: 
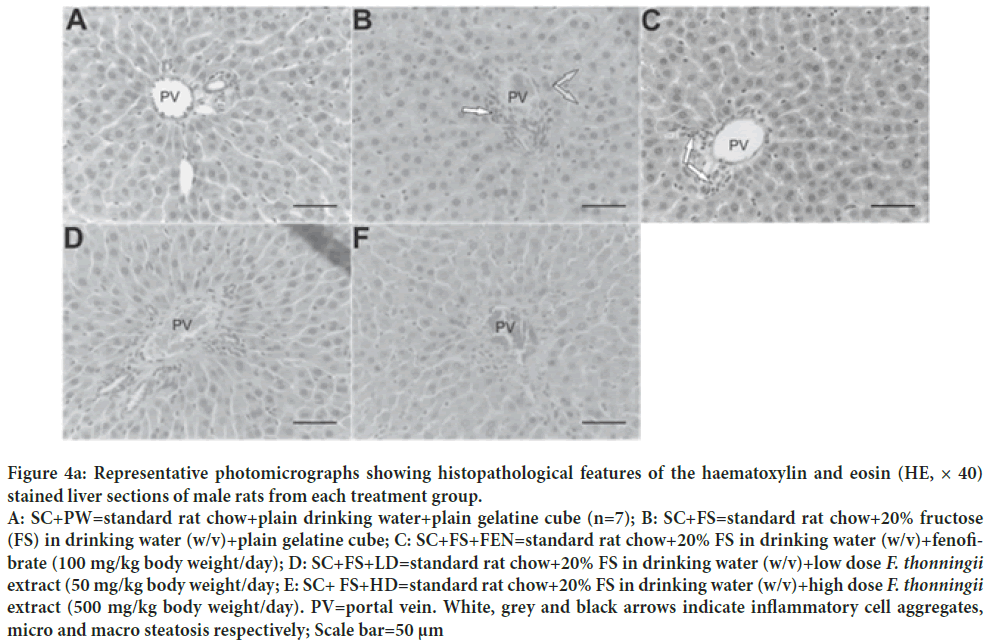
Figure 4a: Representative photomicrographs showing histopathological features of the haematoxylin and eosin (HE, × 40) stained liver sections of male rats from each treatment group. A: SC+PW=standard rat chow+plain drinking water+plain gelatine cube (n=7); B: SC+FS=standard rat chow+20% fructose (FS) in drinking water (w/v)+plain gelatine cube; C: SC+FS+FEN=standard rat chow+20% FS in drinking water (w/v)+fenofibrate (100 mg/kg body weight/day); D: SC+FS+LD=standard rat chow+20% FS in drinking water (w/v)+low dose F. thonningii extract (50 mg/kg body weight/day; E: SC+ FS+HD=standard rat chow+20% FS in drinking water (w/v)+high dose F. thonningii extract (500 mg/kg body weight/day). PV=portal vein. White, grey and black arrows indicate inflammatory cell aggregates, micro and macro steatosis respectively; Scale bar=50 μm
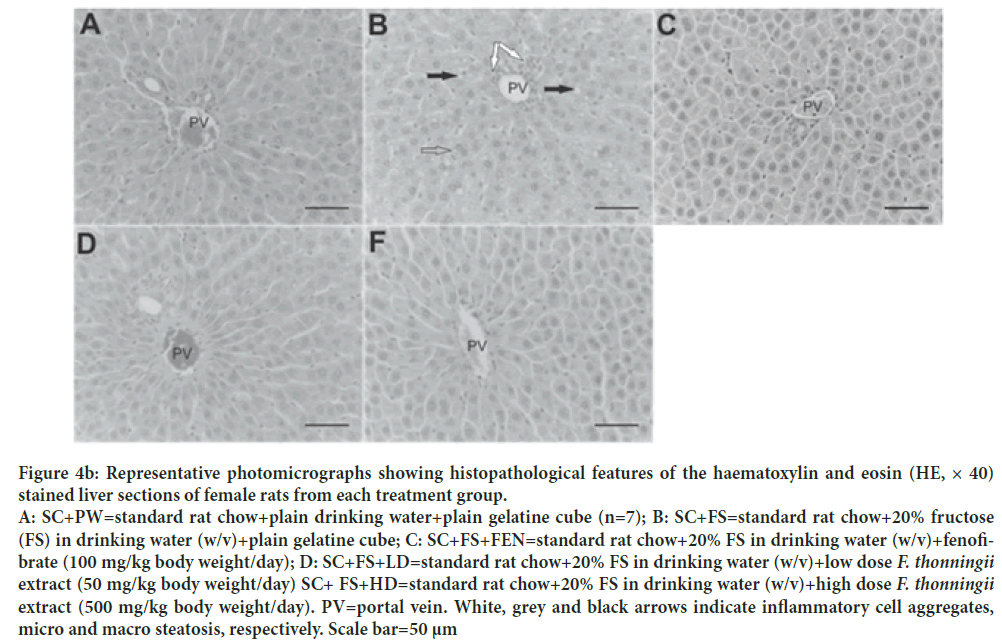
Figure 4b: Representative photomicrographs showing histopathological features of the haematoxylin and eosin (HE, × 40) stained liver sections of female rats from each treatment group. A: SC+PW=standard rat chow+plain drinking water+plain gelatine cube (n=7); B: SC+FS=standard rat chow+20% fructose (FS) in drinking water (w/v)+plain gelatine cube; C: SC+FS+FEN=standard rat chow+20% FS in drinking water (w/v)+fenofibrate (100 mg/kg body weight/day); D: SC+FS+LD=standard rat chow+20% FS in drinking water (w/v)+low dose F. thonningii extract (50 mg/kg body weight/day) SC+ FS+HD=standard rat chow+20% FS in drinking water (w/v)+high dose F. thonningii extract (500 mg/kg body weight/day). PV=portal vein. White, grey and black arrows indicate inflammatory cell aggregates, micro and macro steatosis, respectively. Scale bar=50 μm
Discussion
Dietary fructose alone and or with fenofibrate or crude MEFT as interventions had no effect on rats’ growth performance suggesting that these interventions did not compromise growth. Our findings disagree with Pektaş (Pektaş MB, et al., 2015; Toop and Gentili, 2016) who observed increases in body weight of fructose-fed rats. We contend that the difference in our findings was due to differences in the age of the rats. We used weanling growing rats that are known to channel “extra” fructose calories to support growth and development unlike adult rats that accrete “excess” calories as adipose tissue. The lack of effect of dietary fructose on body weight we report is in tandem with Grau (Grau MM, et al., 2018) observations of similarities in terminal body weight of adolescent SD rats fed 60% fructose solution as a drinking fluid. Badiora (Badiora AS, et al., 2016) showed that orally administered F. thonningii stem-bark extracts increased the body weight of rats. In our study the crude MEFT neither compromised nor promoted rat growth thus they can used without the risk of compromising animal and or child growth.
Dietary fructose-induced hyperglycaemia, deranged lipid profile and insulin resistance, is well documented (Bellamkonda R, et al., 2018). Our findings show that the high-fructose diet alone one and or with fenofibrate or crude MEFT as interventions did not alter the rats’ glucose and insulin concentrations and HOMA-IR indices but the chronic consumption of dietary fructose increased female rats’ blood triglyceride concentration. Thus we infer that the consumption of a high fructose diet for 8 weeks induced hypertriglyceridaemia in female rats only but did not elicit hyperglycaemia and insulin resistance in growing male and female rats. Crude MEFT and fenofibrate did not elicit dysregulation of blood glucose and insulin concentration. Grau MM, et al. contend that fructose consumption stimulates de novo hepatic lipogenesis (DNL) which increases blood triglycerides in rodents. We report, in female rats, significant increase in plasma triglycerides with chronic fructose consumption compared to control counterparts and contend that increased de novo hepatic lipogenesis generates triglycerides that are exported to the systemic circulation hence the increase in plasma triglycerides. We showed similarities in the plasma triglyceride concentration of rats administered the control and that of counterparts fed the high-fructose diet with fenofibrate and or crude MEFT. This demonstrates that both orally administered of low and high dose MEFT and fenofibrate prevented dietary-fructose mediated plasma triglyceride concentration increase in female rats. Crude MEFT can be used as prophylaxis against fructose-induced hypertriglyceridaemia in growing female rats and possibly girl-children.
Mapfumo, et al. (Mapfumo M, et al., 2020; Lê KA, et al., 2009) reported that fructose-rich diets caused hepatic lipid accretion in growing rats’ livers but we show that dietary fructose did not impact the rats’ liver lipid across treatment regimens suggesting that dietary fructose per se and or with either orally administered high dose MEFT or fenofibrate did not alter liver lipid storage of the rats. We also show that female rats fed a high-fructose diet with the low dose MEFT had the highest liver lipid content. This suggests that the low dose MEFT may stimulate excessive hepatic lipid accretion and thereby predispose female rats to higher risk of developing fatty liver diseases. Therefore, despite its prophylactic potential against elements of dietary fructose induced MD, use of low dose MEFT must to be with caution in growing females.
In growing rats we show that chronic dietary fructose intake elicited hepatic inflammation in both rat sexes, micro-and macro-steatosis in females and micro-steatosis in males. In male rats crude MEFT and fenofibrate prevented the dietary fructose induced hepatic micro-steatosis but hepatic inflammation was only prevented by the MEFT. The low and high dose MEFT and fenofibrate mitigated the dietary fructose-induced hepatic steatosis and inflammation in female rats. The crude MEFT appear more efficacious in protecting against dietary fructose induced steatosis and inflammation compared to fenofibrate which did not attenuate dietary fructose induced hepatic inflammation in growing male rats. We speculate that the mutli-therapeutic effects of phytochemicals in crude MEFT make them better prophylactic agents compared to the monotherapeutic fenofibrate
Conclusion
Fructose elicited hypertriglyceridaemia in a sexually dimorphic manner and caused hepatic inflammation and steatosis in both rat sexes. Crude low and high dose MEFT prevented dietary fructose induced hypertriglyceridaemia, hepatic inflammation and steatosis hence they can be used as prophylaxis against elements of diet-induced MD in growing SD rats and maybe in children. Caution must be taken as low dose MEFT can predispose females to increased risk of developing fatty liver disease.
Acknowledgement
We thank the National Research Foundation, South Africa and Wits University Faculty of Health Sciences Research Committee for funding our study.
References
- Obesity and overweight: Fact sheet. World Health Organisation (WHO). 2018.
- Muthuri SK, Francis CE, Wachira LJM, LeBlanc AG, Sampson M, Onywera VO, et al. Evidence of an overweight/obesity transition among school-aged children and youth in Sub-Saharan Africa: A systematic review. PLoS ONE 9(3): e92846.
- Pienaar AE, Prevalence of overweight and obesity among primary school children in a developing country: NW-CHILD longitudinal data of 6-9-yr-old children in South Africa. BMC Obesity 2(1): 2015.
- Sekgala MD, Monyeki KD, Mogale A, Parker W, Makgopa HM, Mchiza ZJ. The risk of metabolic syndrome as a result of lifestyle among Ellisras rural young adults. J Hum Hypertens. 2018; 32: 572-584.
- Zhang Yi, Liu J, Yao J, Ji G, Qian L, Wang J, et al. Obesity: Pathophysiology and Intervention. Nutrients. 2014; 6(11): 5153-5183.
- Jensen VS, Hvid H, Damgaard J, Nygaard H, Ingvorsen C, Wulff EM, et al. Dietary fat stimulates development of NAFLD more potently than dietary fructose in Sprague-Dawley rats. Diabetol Metab Syndr. 2018; 10(4): 1-13.
- Matsuzawa Y. Obesity and metabolic syndrome: The contribution of visceral fat and adiponectin. Diabetes Manag. 2014; 4(4): 391-401.
- Kraja A, Province M, Straka R, Ordovas J, Borecki IK, Arnett D. Fenofibrate and metabolic syndrome, endocrine, metabolic and immune disorders. Drug Targets. 2010; 10(2): 138-148.
- Li XM, Li Y, Zhang NN, Xie YH, Shi YQ. Combination therapy with metformin and fenofibrate for insulin resistance in obesity. The J Int Med Sci Res. 2011; 39: 1876-1882.
- Rodgers RJ, Tschöp MH, Wilding JPH. Anti-obesity drugs: Past, present and future. Dis Model Mech. 2012; 5(5): 621-626.
- Amiot MJ, Riva C, Vinet A. Effects of dietary polyphenols on metabolic syndrome features in humans: A systematic review. Obes Rev. 2016; 17(7): 573-586.
- Oyebode O, Kandala N, Chilton PJ, Lilford RJ. Use of traditional medicine in middle-income countries: A WHO-SAGE study. Health Policy Plan. 2016; 31: 984-991.
- Teklehaymanot T, Giday M. Ethnobotanical study of medicinal plants used by people in Zegie Peninsula, Northwestern Ethiopia. J Ethnobiol Ethnomed. 2007; 3(1): 12.
- Egharevba HO, Carew O, Kunle OF. Phytochemical and pharmacognostic analysis of Ficus thonningii blume leaves for monograph development. International J Basic Appl Sciences. 2015; 4(2): 94-100.
- Fitrilia T, Bintang M, Safithri M. Phytochemical screening and antioxidant activity of clove mistletoe leaf extracts (Dendrophthoe pentandra (L.) Miq). IOSR J Pharm. 2015; 5(8): 13-18.
- Musabayane CT, Gondwe M, Kamadyaapa DR, Chuturgoon AA, Ojewole JAO. Effects of Ficus thonningii (Blume) [Morarceae] stem-bark ethanolic extract on blood glucose, cardiovascular and kidney functions of rats, and on kidney cell lines of the proximal (LLC-PK1) and distal tubules (MDBK). Ren Fail. 2007; 29(4): 389-397.
- Kamerman PR, Modisa BME, Mphahlele NR. Artovastatin, a potent HMG-CoA reductase inhibitor, is not antipyretic in rats. J Therm Biol. 2004; 29(4): 431-435.
- Loxham SJG, Teague J, Poucher SM, De Schoolmeester J, Turnbull AV, Carey F. Glucagon challenge in the rat: A robust method for the in vivo assessment of Glycogen phosphorlyase inhibitor efficacy. J Pharmacol Toxicol Met. 2007; 55(1): 71-77.
- Matthews DR, Hosker JR, Rudenski AS, Naylor BA, Treacher DF, Turner RC. Homeostasis model assessment: Insulin resistance and β-cell function from fasting plasma glucose and insulin concentrations in man. Diabeologia. 1985; 28: 412-419.
- Horwitz W, Latimer GW. Official methods of Analysis of Analytical Chemists International (AOAC). 2005.
- Liang W, Menke AL, van den Hoek A. Establishment of a general NAFLD scoring system for rodent models and comparing it to human liver pathology. PLoS One. 2014; 9(12): e115922.
- Pektaş MB, Sadi G, Akar F. Long-Term dietary fructose causes gender-different metabolic and vascular dysfunction in rats: Modulatory effects of resveratrol. Cell. Physiol Biochem. 2015; 37(4): 1407-1420.
- Toop C, Gentili S. Fructose beverage consumption induces a metabolic syndrome phenotype in the rat: A systematic review and meta-analysis. Nutrients. 2016; 8(9): 577.
- Grau MM, Pardo-Tendero MM, Morales JM, Perez IA, Pellin-Carcelen, Monleón D, et al. Alterations in metabolic profile and liver histology of lean rats under high fructose diet. J Hypert. 2018; 36: 6211.
- Badiora AS, Agbi AJ, Ogunleye SG, Areola JO, Babalola OO. Toxicological evaluation of Ficus thonningii blume (Moraceae) stem bark extract on the liver, kidney and testes of adult wistar rats. Am J Biochem. 2016; 6(3): 59-71.
- Bellamkonda R, Karuna R, Rao BSB, Haritha K, Manjunatha B, Silpa S, et al. Beneficiary effect of Commiphora mukul ethanolic extract against high fructose diet induced abnormalities in carbohydrate and lipid metabolism in wistar rats. J Trad Complement Med. 2018; 8: 203-211.
- Mapfumo M, Lembede BW, Nkomozepi P, Ndhlala AR, Chivandi E. Crude Moringa oleifera Lam. seed extract attenuates non-alcoholic fatty liver disease in growing Sprague-Dawley rats. South Afr J Bot. 2020; 129: 191-197.
- Lê KA, Ith M, Kreis R, Faeh D, Bortolotti M, Tran C, et al. Fructose overconsumption causes dyslipidemia and ectopic lipid deposition in healthy subjects with and without a family history of type 2 diabetes. The Am J Clin Nutr. 2009; 89(6): 1760-1765.
Author Info
Eliton Chivandi1*, Yvonne Mhosva1, Trevor Nyakudya2 and Pilani Nkomozepi32Department of Physiology, Faculty of Health Sciences, University of Pretoria, Arcadia, South Africa
3Department of Human Anatomy and Physiology, Faculty of Health Sciences, University of Johannesburg, Johannesburg, South Africa
Citation: Chivandi E: Ficus thonningii Stem Bark Extracts Prevent High Fructose Diet Induced Increased Plasma Triglyceride Concentration, Hepatic Steatosis and Inflammation in Growing Sprague-Dawley Rats
Received: 07-Feb-2022 Accepted: 22-Feb-2022 Published: 01-Mar-2022, DOI: 10.31858/0975-8453.13.3.205-212
Copyright: This is an open access article distributed under the terms of the Creative Commons Attribution License, which permits unrestricted use, distribution, and reproduction in any medium, provided the original work is properly cited.
ARTICLE TOOLS
- Dental Development between Assisted Reproductive Therapy (Art) and Natural Conceived Children: A Comparative Pilot Study Norzaiti Mohd Kenali, Naimah Hasanah Mohd Fathil, Norbasyirah Bohari, Ahmad Faisal Ismail, Roszaman Ramli SRP. 2020; 11(1): 01-06 » doi: 10.5530/srp.2020.1.01
- Psychometric properties of the World Health Organization Quality of life instrument, short form: Validity in the Vietnamese healthcare context Trung Quang Vo*, Bao Tran Thuy Tran, Ngan Thuy Nguyen, Tram ThiHuyen Nguyen, Thuy Phan Chung Tran SRP. 2020; 11(1): 14-22 » doi: 10.5530/srp.2019.1.3
- A Review of Pharmacoeconomics: the key to “Healthcare for All” Hasamnis AA, Patil SS, Shaik Imam, Narendiran K SRP. 2019; 10(1): s40-s42 » doi: 10.5530/srp.2019.1s.21
- Deuterium Depleted Water as an Adjuvant in Treatment of Cancer Anton Syroeshkin, Olga Levitskaya, Elena Uspenskaya, Tatiana Pleteneva, Daria Romaykina, Daria Ermakova SRP. 2019; 10(1): 112-117 » doi: 10.5530/srp.2019.1.19
- Dental Development between Assisted Reproductive Therapy (Art) and Natural Conceived Children: A Comparative Pilot Study Norzaiti Mohd Kenali, Naimah Hasanah Mohd Fathil, Norbasyirah Bohari, Ahmad Faisal Ismail, Roszaman Ramli SRP. 2020; 11(1): 01-06 » doi: 10.5530/srp.2020.1.01
- Manilkara zapota (L.) Royen Fruit Peel: A Phytochemical and Pharmacological Review Karle Pravin P, Dhawale Shashikant C SRP. 2019; 10(1): 11-14 » doi: 0.5530/srp.2019.1.2
- Pharmacognostic and Phytopharmacological Overview on Bombax ceiba Pankaj Haribhau Chaudhary, Mukund Ganeshrao Tawar SRP. 2019; 10(1): 20-25 » doi: 10.5530/srp.2019.1.4
- A Review of Pharmacoeconomics: the key to “Healthcare for All” Hasamnis AA, Patil SS, Shaik Imam, Narendiran K SRP. 2019; 10(1): s40-s42 » doi: 10.5530/srp.2019.1s.21
- A Prospective Review on Phyto-Pharmacological Aspects of Andrographis paniculata Govindraj Akilandeswari, Arumugam Vijaya Anand, Palanisamy Sampathkumar, Puthamohan Vinayaga Moorthi, Basavaraju Preethi SRP. 2019; 10(1): 15-19 » doi: 10.5530/srp.2019.1.3

