Research Article - (2022) Volume 13, Issue 7
Identification of the Key miRNAs and Target Genes in Basal Cell Carcinoma by Bioinformatics Analysis
Hao Liu*Abstract
The highly tissue-destructive and localized accumulation of Basal Cell Carcinoma (BCC) makes it one of the most important cancers affecting people’s lives. Existing therapeutic approaches, including surgical treatment, chemotherapy, and Hedgehog pathway inhibitors, have failed to achieve broad therapeutic effects for various reasons. This study aims to explore additional potential therapeutic targets and possible diagnostic and prognostic biomarkers using bioinformatics analysis. The Gene Expression Omnibus (GEO) database identified the microarray dataset GSE34535. The GEO2R tool was used to screen out Differentially Expressed Genes (DEGs) between BCC and non-lesional skin. Potential target genes of DE-miRNA were screened using the miRWalk, mirDIP and miRTarBase databases. Gene Ontology function and Kyoto Encyclopedia of Genes and Genomes pathway enrichment analysis for target genes were established using the DAVID database. Protein-protein interaction network and miRNA-hub gene network were analyzed based on the STRING database and visualized by Cytoscape software. 51 up-regulated DE-miRNAs and 38 down-regulated DE-miRNAs were identified from the BCC samples. miR-455-5p was mainly up-regulated and miR-139-5p was mainly down-regulated. Two key hub genes MAPK1 and EGFR were identified in the PPI network. Four out of the ten hub genes were regulated by up-regulated miR-18a and four by down-regulated miR-133b. Viral infections were also identified in the study, which may play a role in BCC.
Keywords
Bioinformatics analysis, Basal cell carcinoma, miRNAs
Introduction
Basal Cell Carcinoma (BCC), or basal cell epithelioma, originates in the basal cell layer of the epidermis and skin appendages that is one of the most common cancers affecting human life. Clinically, BCC mostly occurs at the site of exposure, with the head and neck being the most common. The majorities of BCCs grow slowly and rarely metastasize, but when cancerous tissue is not adequately removed or treated in a timely manner, BCCs may develop local metastasis, which is highly destructive and causes a structural destruction-like appearance of surrounding tissues (Fania L, et al., 2020) and may even lead to a small number of deaths. Therefore, improving the early detection rate and carrying out effective treatment are effective ways to avoid the progression of BCC in an undesirable direction. BCC is mainly prevalent in older men (Lomas A, et al., 2012), but in recent years the trend of younger and more feminine people is also becoming more apparent (Ciążyńska M, et al., 2018). The interaction between environmental, phenotypic and genetic factors is a risk factor for the development of BCC (Dika E, et al., 2020), but the molecular mechanisms underlying its occurrence and development have not yet been fully elucidated. Surgical approach is the first choice for the treatment of BCC, especially Mohs micrographic surgery, which has a high cure rate. If surgery is contraindicated, radiotherapy is the main alternative treatment for BCC. However, these methods are not always applicable, especially for institutions that lack experienced specialists and relevant pathology testing equipment (Fania L, et al., 2020). And for patients with Local advanced BCC (LaBCC), the cancer has caused extensive tissue destruction in the surrounding anatomical region, which makes it impossible to treat the tumor through surgery or radiation therapy (Dika E, et al., 2020). Hedgehog (Hh) pathway inhibitors have been developed for use in patients with locally advanced or rare metastatic BCC (Peris K, et al., 2015), but the prevalence of drug resistance (Atwood SX, et al., 2012) and side effects (Sekulic A, et al., 2012) has limited their widespread use. Therefore, it is urgent to explore the underlying molecular mechanisms of BBC and find more useful early diagnostic techniques and more reliable molecular markers to monitor recurrence, assess prognosis and provide new ideas for targeted therapy.
MicroRNAs (miRNAs) are small RNAs between 21-25 nucleotides in length that can influence genes through potential pathways, but do not encode genes. They have been found to be present in various biological processes and play an important regulatory role in the translation and degradation of messenger RNA (mRNA) by binding to mRNA (Calin GA and Croce CM, 2006). They are also known to be closely associated with the development and progression of various diseases. Especially in tumors, there have been a large number of discoveries targeting different types of tumors, which provide effective ways to diagnose and treat the diseases. For BCC, similar studies have been conducted to investigate the differences in miRNAs expression in lesioned versus non-lesioned regions in patients with general BCC (Sand M, et al., 2007), in patients with different subtypes of BCC (Heffelfinger C, et al., 2012) or in an extensive cranial BCC patient receiving oral vismodegib therapy (Sand M, et al., 2016). Their study identified a series of up-and down-regulated miRNAs, including miR-203, miR-183, miR-183, miR-29c, and others. These initial studies demonstrated that miRNAs are involved in BCC and revealed the importance of miRNAs in the development and prognosis of BCC. However, more studies, such as gene array studies to investigate the role of miRNAs and target genes, are needed to better reveal the role of miRNAs in the pathogenesis of BCC. Therefore, this study aimed to identify miRNAs and target genes associated with prognosis or treatment in BCC using bioinformatics analysis. The study included screening for DE-miRNAs, analysis of functional and pathway enrichment, and construction of PPI networks, to identify the novel targets.
Materials and Methods
Data source
The gene expression data of BCC were obtained from the GEO database (https://www.ncbi.nlm.nih.gov/geo/). The microarray dataset GSE34535 based on GPL15019, which included 14 samples from the center of the tumors and from sites of adjacent non-lesional skin, was selected and used in this study.
Screening for DE-miRNA
The online GEO2R analysis tool (https://www.ncbi.nlm.nih.gov/geo/ geo2r/) from GEO database was used to compare the differences between BCC tissue and adjacent non-lesional tissue, and adjusted P-value and |logFC| were calculated. The screening threshold for DE-miRNA was set to adjust P-value <0.05 and |logFC| was defined as >1.
Analyses of miRNA-mRNA targets
In this section, we identified the top 10 up-and down-regulated DE-miRNAs. Three commonly used miRNA-targeting tools: miRWalk V3.0 database, mirDIP and miRTarBase were used to predict the targets of DEGs. Statistical analysis of prediction results for each tool was carried and intersecting parts were identified using the Venn diagram webtool (http://bioinformatics.psb.ugent.be/webtools/Venn/) to screen the miRNA tar-gets. Then, use the Cytoscape software (http://cytoscape.org/) to visualize the miRNA-mRNA networks.
GO (Gene Ontology) and KEGG (Kyoto Encyclopedia of Genes and Genomes) pathway analysis of DEGs
GO and KEGG pathway analysis are widely used in bioinformatics research, which revealed the Biological Processes (BPs), Cellular Components (CCs), Molecular Functions (MFs) and pathways associated with the object of study. In this study, the Database for Annotation, Visualization and Integrated Discovery (DAVID) (https://david.ncifcrf.gov) was used to perform GO annotation analysis and KEGG pathway enrichment analysis on DEGs. P<0.05 was considered statistically significant.
Construction of PPI network and identification of hub genes
We used the Search Tool for Retrieval of Interacting Genes (STRING) database (http://string-db.org/) to analyze the PPI network. The results were visualized and presented by Cytoscape software, where we simultaneously used Cytoscape’s plug-in cytoHubba to calculate the degree of each protein node.
Results
Identification of DE-miRNAs
The microarray dataset GSE34535 was downloaded from the GEO database included 7 cases of BCC (GSM850677-GSM850683) and 7 intraindividual controls (GSM850684-GSM85690). Adjust P-value<0.05 and |logFC|>1 was considered as criteria for screening DE-miRNAs. 89 DE-miRNAs were identified from dataset (Figure 1), including 51 up-regulated miRNAs and 38 down-regulated miRNAs. Noteworthy, the expression of HCMV, HSV1 and HSV2 virus-associated miRNAs was lower in BCC tissues than in control tissues, especially hcmv-miR-UL70-3p was in the 9th place among the down-regulated miRNAs and hsv1-miR-H17 was in the 11th place. Table 1lists the 10 most significantly up-regulated miRNAs and the 10 most significantly down-regulated miRNAs (exclusion of virus-associated miRNAs). Table 2lists the down-regulated viral-associated miRNAs.
| miRNAs | Log FC | t | P-value | Adjusted P-value | B | Up/Down | Count of target mRNA |
|---|---|---|---|---|---|---|---|
| hsa-miR-455-5p | 7.70495 | 13.3812 | 7.05E-09 | 4.82E-06 | 10.7467 | Up | 24 |
| hsa-miR-181c | 7.25346 | 10.6394 | 1.05E-07 | 4.77E-05 | 8.2384 | Up | 75 |
| hsa-miR-424 | 6.51312 | 5.154 | 1.97E-04 | 0.002276 | 0.7736 | Up | 159 |
| hsa-miR-181d | 6.39348 | 9.2825 | 4.95E-07 | 0.000108 | 6.7413 | Up | 117 |
| hsa-miR-182 | 6.14254 | 6.3619 | 2.72E-05 | 0.002276 | 2.7667 | Up | 56 |
| hsa-miR-196b | 5.90599 | 3.7337 | 2.58E-03 | 0.003686 | -1.8065 | Up | 42 |
| hsa-miR-542-5p | 5.76404 | 9.1969 | 5.49E-07 | 0.000108 | 6.6402 | Up | 2 |
| hsa-miR-96 | 5.58655 | 3.5586 | 3.60E-03 | 0.005075 | -2.1352 | Up | 78 |
| hsa-miR-18a | 4.95005 | 6.2618 | 3.18E-05 | 0.002276 | 2.6096 | Up | 94 |
| hsa-miR-183 | 4.71868 | 3.3102 | 5.77E-03 | 0.008073 | -2.6017 | Up | 57 |
| hsa-miR-139-5p | -5.96871 | -13.7775 | 4.97E-09 | 4.82E-06 | 11.0614 | Down | 39 |
| hsa-miR-378a-5p (previously hsa-miR-378) | -5.06569 | -4.5647 | 5.57E-04 | 0.002276 | -0.2716 | Down | 2 |
| hsa-miR-378a-3p (previously hsa-miR-378) | -4.39151 | -3.3782 | 5.07E-03 | 0.007122 | -2.4742 | Down | 5 |
| hsa-miR-29c | -4.26472 | -4.5025 | 6.24E-04 | 0.002276 | -0.3844 | Down | 64 |
| hsa-miR-133b | -4.25411 | -3.8503 | 2.08E-03 | 0.002967 | -1.5882 | Down | 24 |
| hsa-miR-30a | -3.56838 | -3.9632 | 1.68E-03 | 0.002415 | -1.3775 | Down | 14 |
| hsa-miR-139-3p | -3.26283 | -3.0239 | 9.97E-03 | 0.013829 | -3.137 | Down | 0 |
| hsa-miR-452 | -2.82007 | -2.8071 | 1.51E-02 | 0.020646 | -3.5374 | Down | 12 |
| hsa-miR-3188 | -2.4158 | -2.5558 | 2.42E-02 | 0.032782 | -3.9931 | Down | 0 |
| hsa-miR-193a-5p | -2.17912 | -3.3524 | 5.33E-03 | 0.007465 | -2.5225 | Down | 10 |
Note: FC: Fold change
Table 1: Top ten up-regulated and down-regulated differentially expressed miRNAs
| miRNAs | Log FC | t | P-value | Adjusted P-value | B | Up/Down |
|---|---|---|---|---|---|---|
| hcmv-miR-UL70-3p | -2.52868 | -2.53E+00 | 2.55E-02 | 0.034272 | -4.04 | Down |
| hsv1-miR-H17 | -2.35761 | -2.81E+00 | 1.50E-02 | 0.020642 | -3.5363 | Down |
| hsv1-miR-H7 | -1.53093 | -4.26E+00 | 0.000974 | 0.002276 | -0.8323 | Down |
| hsv2-miR-H10 | -1.29316 | -3.70E+00 | 0.00275 | 0.00391 | -1.8671 | Down |
| hsv2-miR-H24 | -1.2658 | -3.36E+00 | 0.0053 | 0.007435 | -2.5175 | Down |
| kshv-miR-K12-3 | -1.03869 | -2.97E+00 | 0.011 | 0.015198 | -3.2308 | Down |
Note: FC: Fold change
Table 2: The down-regulated viral-associated miRNAs
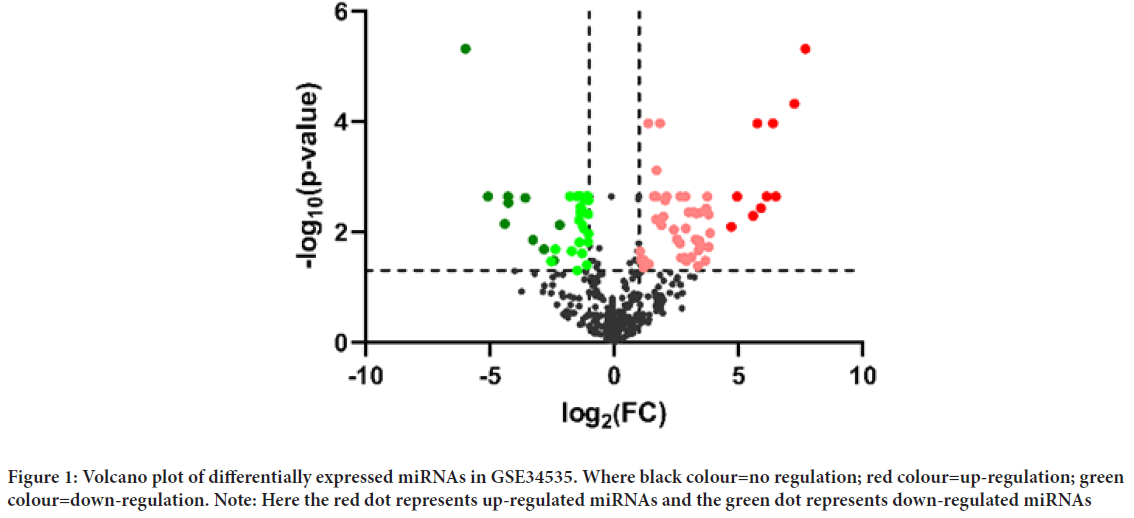
Figure 1: Volcano plot of differentially expressed miRNAs in GSE34535. Where black colour=no regulation; red colour=up-regulation; green colour=down-regulation. Note: Here the red dot represents up-regulated miRNAs and the green dot represents down-regulated miRNAs
miRNAs-target gene interactions
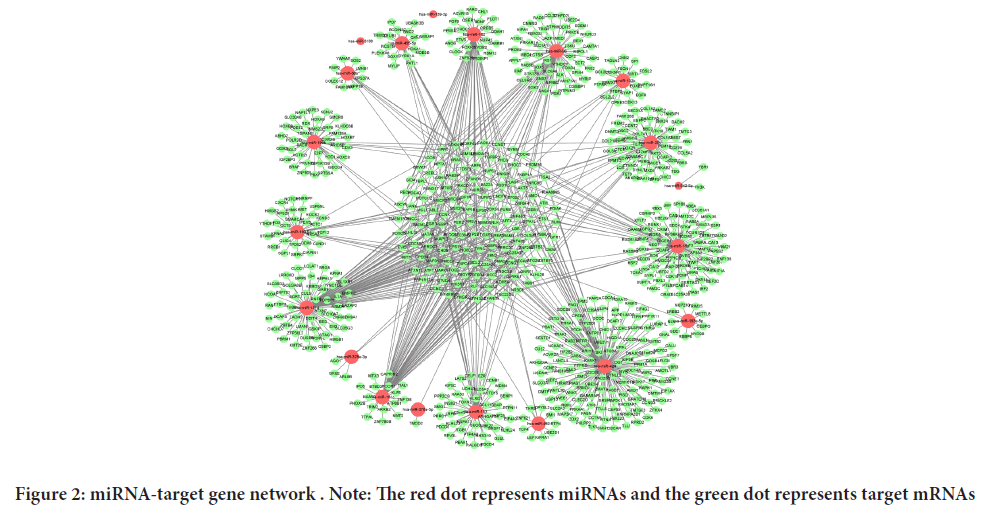
After processing and analyzing the data predicted from the three databases, a total of 874 overlapping genes regarding twenty miRNAs were obtained. These overlapping genes are reliable target genes that may interact with miRNAs. Possible targets are verified by more than four algorithms with a high degree of confidence. The miRNA-mRNA network was visualized by Cytoscape and is displayed in Figure 2. The count of target genes for the corresponding miRNAs is listed in Table 1.
Figure 2: miRNA-target gene network . Note: The red dot represents miRNAs and the green dot represents target mRNAs
Enrichment analyses of target genes
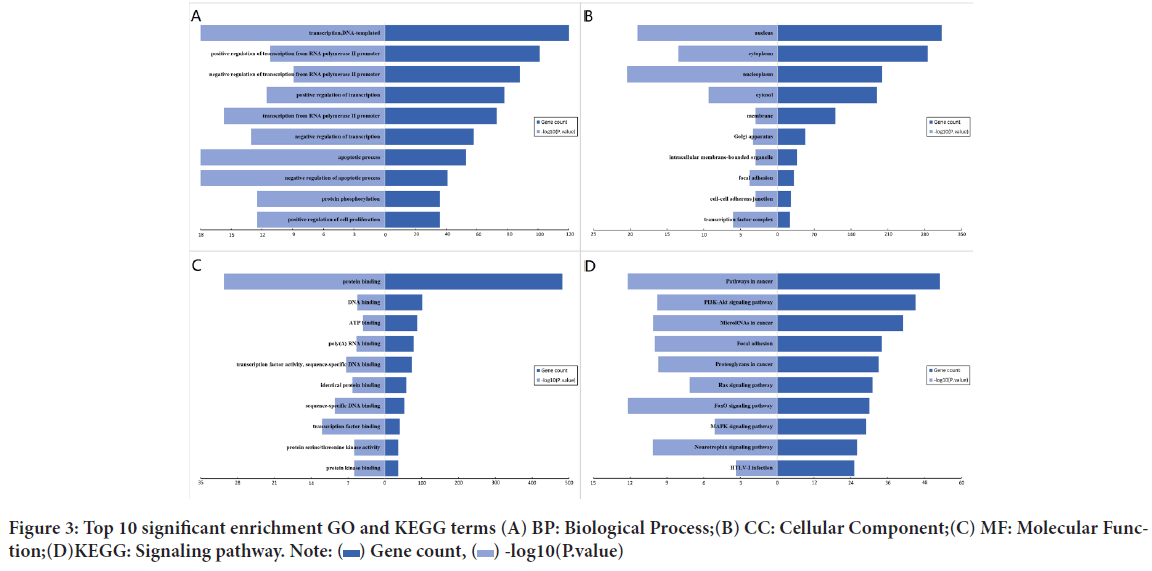
To explore the functions of the target genes, we analyzed 874 genes screened using the DAVID online tool. In the GO annotation, three items closely related to function, BP, CC and MF, were chosen for annotation. The significantly enriched entries for BP were transcription, DNA-templated, positive regulation of transcription from RNA polymerase II promoter and negative regulation of transcription from RNA polymerase II promoter (Figure 3A). Furthermore, the nucleus, cytoplasm and nucleoplasm were the most concentrated entries in CC term (Figure 3B). The most enriched MF were protein binding, DNA binding and ATP binding (Figure 3C). KEGG pathway enrichment analysis showed that the regulation of DE-miRNAs were significantly enrichment in pathways in cancer, PI3K-Akt signaling pathway and microRNA’s in cancer. Intriguingly, the enrichment in HTLA-I infection was found to have a possible role in BCC (Figure 3D).
Figure 3: Top 10 significant enrichment GO and KEGG terms (A) BP: Biological Process;(B) CC: Cellular Component;(C) MF: Molecular Function;(D)KEGG: Signaling pathway. Note:
Construction of PPI network and identification of hub genes
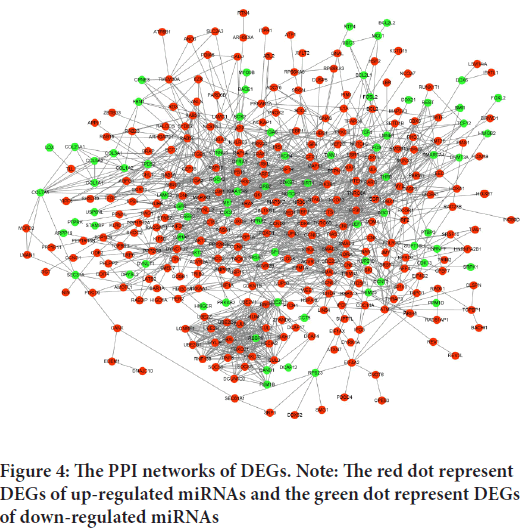
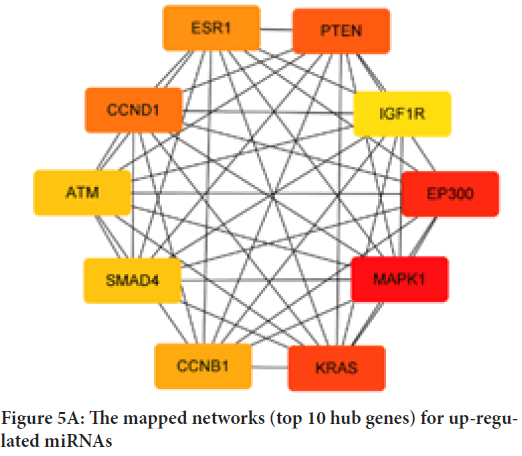
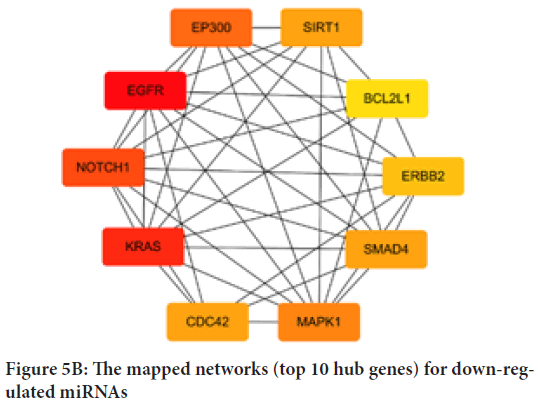
To explore the interactions between target genes, we used the STRING database to predict the PPI network. There are 366 nodes and 1,559 edges involved in the construction of the PPI network, as shown in Figure 4. The top ten hub genes of up- and down-regulated miRNAs were identified and evaluated separately by degree, as shown in Table 3. For up-regulated miRNAs, MAPK1, EP300, KRAS, PTEN, CCND1, ESR1, CCNB1, SMAD4, ATM and IGF1R were the top ten hub genes, and MAPK1 showed the highest node degree (node degree=91). For down-regulated miRNAs, the leading ten hub genes were EGFR, KRAS, NOTCH1, EP300, MAPK1, CDC42, SIRT1, SMAD4, ERBB2 and BCL2L1 and EGFR showed the highest node degree (node degree=39). Figure 5shows the networks of the top 10 hub genes.
| Up-regulated miRNAs | Down-regulated miRNAs | ||
|---|---|---|---|
| Gene symbol | Degree | Gene symbol | Degree |
| MAPK1 | 91 | EGFR | 39 |
| EP300 | 80 | KRAS | 34 |
| KRAS | 77 | NOTCH1 | 33 |
| PTEN | 76 | EP300 | 32 |
| CCND1 | 73 | MAPK1 | 30 |
| ESR1 | 66 | CDC42 | 26 |
| CCNB1 | 56 | SIRT1 | 2.60E+01 |
| SMAD4 | 54 | SMAD4 | 26 |
| ATM | 54 | ERBB2 | 25 |
| IGF1R | 53 | BCL2L1 | 22 |
Table 3: Top ten hub genes in network ranked by degree
Figure 4: The PPI networks of DEGs. Note: The red dot represent DEGs of up-regulated miRNAs and the green dot represent DEGs of down-regulated miRNAs
Figure 5A: The mapped networks (top 10 hub genes) for up-regulated miRNAs
miRNA-hub gene network
We mapped the miRNA-hub gene network, as shown in Figure 6, to further clarify the interactions between DE-miRNA and hub genes. For up-regulated miRNAs, four out of ten genes (ESR1, PTEN, ATM and CCND1) could be potentially modulated by has-miR-18a. Has-miR-182, has-miR-96 and has-miR-183 each could target three genes. Has-miR-196b, has-miR-181c and has-miR-181d each could potentially modulate one gene. Also, for down-regulated miRNAs, has-miR-133b may potentially regulate 4 of the 10 central genes (SIRT1, BCL2L1, CDC42 and EGFR). Two hub genes could be potentially modulated by has-miR-30a. Has-miR-193a-5p, has-miR-452, has-miR-378a-3p, has-miR-29c and has-miR-139-5p each could potentially regulate one gene. Therefore, has-miR-18a and has-miR-133bwere thought to be the most associated with the development and progression of BCC.
Figure 5B: The mapped networks (top 10 hub genes) for down-regulated miRNAs
Discussion
BBC is a less malignant tumor. Although it rarely metastasizes, its high degree of tissue destruction and local accumulation make it one of the most important cancers affecting people’s lives. Existing therapeutic approaches, including surgical treatment, chemotherapy, and Hedgehog pathway inhibitors, have failed to achieve broad therapeutic effects for various reasons. Therefore, more potential therapeutic targets and possible diagnostic and prognostic biomarkers need to be explored.
In this study, 89 DE-miRNAs in BCC tissues compared to normal skin tissue samples were identified by differential expression analysis of miRNA arrays downloaded from the GEO database. In BCC, has-miR-455-5p was mainly up-regulated and has-miR-139-5p was mainly down-regulated. Meanwhile, the miRNA-hub gene interaction network showed that has-miR-18a and has-miR-133b were the most associated with the hub genes among the up- or down-regulated miRNAs. Thus, the four miRNAs with the most significant expression differences or the most extensive interactions are the most likely key DE-miRNAs affecting the development of BCC.
For up-regulated miRNAs, miRNA-455-5p and miRNA-18a were confirmed to have the same expression difference in another but more targeted single-case BCC study (Sand M, et al., 2016). In cancer research, miR-455- 5p is considered as a potential oncogenic factor closely related to tumors. In colon cancer, miR-455-5p promotes HT29 cell proliferation and inhibits HT29 cell apoptosis by suppressing galectin-9 expression, thus indirectly participating in colon cancer progression (Yang Q, et al., 2017). Also, it has been suggested that miRNA-455-5p is associated with bladder cancer progression and its overexpression may suggest a poor prognosis of bladder cancer (Bi H, et al., 2020). In non-small cell lung cancer, researchers found that miR-455-5p expression was significantly upregulated in tumor tissues. Further studies showed that it was miR-455-5p that increased the growth rate and invasiveness of NSCLC by inhibiting SOCS3 (Zakrzewska K, et al., 2012). The pro-carcinogenic effect of miR-455-5p has also been demonstrated in other tumors (Chen W, et al., 2020; Cao J, et al., 2021). In this study, miRNA-455-5p was considered to be the most significantly up-regulated expression in BCC, but at the same time, it was not involved in the regulation of the top ten hub genes of up-regulated miRNAs. Further studies on the molecular mechanism of miRNA-455-5p involved in the development of BCC are still needed. Considering its significant high expression in cancer tissues, we suggest that miRNA-455-5p has a suggestive role. Expression of miRNA-18a is associated with several human malignancies and appears to exhibit opposing effects. In a study on clear cell renal cell carcinoma, researchers proposed that upregulation of miRNA-18a has a positive effect on the migration and invasion of ccRCC cells and that miRNA18a/HIF1A/PVT is a key pathway that may play a role in the progression of ccRCC (Wang H, et al., 2020). In contrast, another study on breast cancer suggested that miRNA-18a plays an oncogenic role in the early development of breast cancer, and its high expression is beneficial for survival (Kim SY, et al., 2017). In addition, miRNA-18a was also shown to be highly overexpressed in patients with esophageal squamous cell carcinoma, and its level of expression was significantly reduced after completion of chemoradiotherapy (Noor MT, et al., 2020). In this study, miRNA-18a was closely associated with four of the ten hub genes and may play a key role in the development of BCC. However, it’s up-regulated expression plays a positive or negative role in BCC still needs further investigation.
For down-regulated miRNAs, miRNA-139-5p was also confirmed to be down-regulated in a similar study (Sand M, et al., 2016). In several studies, miRNA-139-5p has been suggested to be a negative regulator of cancer development, exhibiting potent anti-tumor activity. In esophageal cancer, the expression level of miR-139-5p was significantly lower compared with that in paracancerous tissues, and the expression level in serum also closely correlated with tumor stage. Further studies revealed that miR-139-5p played a regulatory role in inhibiting the development of esophageal cancer, and its high expression inhibited the proliferation of esophageal cancer cells by regulating the signaling pathways of VEGFR and its downstream primers (Jiao W, et al., 2019). In contrast, low expression of miR-139-5p in tumor patients suggested poor prognosis. Similar effects have been demonstrated in other studies, where miR-139-5p was significantly under-expressed in cancer tissues, while multiple pathways such as CXCR4, PKM2, RPRD1B and NOTCH1 could be negatively regulated by regulating miR-139-5p levels to inhibit the development of various cancers such as oral squamous cell carcinoma (Jiang Q, et al., 2020), gallbladder cancer and breast cancer (Chen J, et al., 2018). In this study, miRNA-139-5p downregulation in BCC tissues may suggest poor prognosis. And the high expression of miR-139- 5p may be involved in inhibiting the proliferation, migration and invasion process of cancerous basal cells through similar pathways, exerting an oncogenic effect. The differential expression of miRNA-133b in BCC was not mentioned in other studies. In this study, BCC tissues expressed lower miRNA-133b compared to normal skin tissues (logFC=-4.25411), which was located in the 5th position of the top 10 down-regulated DE-miRNAs. miRNA-hub gene network showed that miRNA-133b may be involved in regulating four of the ten hub genes (EGFR, SIRT1, BCL2L1 and CDC42). In other tumor studies, miRNA-133b exhibited similar oncogenic effects to miR-139-5p which was also lowly expressed in cancerous tissues. When overexpressed, it inhibits the development of osteosarcoma (Zhang HD, et al., 2015), FAP-derived desmoid tumor (Gao G, et al., 2018), clear cell renal cell carcinoma (Rotelli MT, et al., 2020) and hepatocellular carcinoma (Zhou W, et al., 2016) through the FGFR1, SIRT1, JAK2/STAT3, and SF3B4 pathways. The low expression of miRNA-133b in BCC in this study may have the same suggestive effect as miR-139-5p. Therefore, we speculate that miR-139-5p and miRNA-133b might be a negative modulator for the development of BCC, but more experimental validation is needed.
In the present study, we performed GO terms and KEGG pathway enrichment for 20 miRNAs which were significantly up-regulated and significantly down-regulated with the help of DAVID database. GO analysis revealed a significant enrichment of DEGs in cell replication and apoptosis, with these pathways showing a great role in BCC progression. KEGG pathway analysis showed that DEGs were significantly enriched in various tumor pathways and PI3K-Akt pathway. The role of PI3K-Akt signaling pathway in BCC remains unclear. In previous studies, PI3K-Akt was considered to be the framework of malignant behavior, deeply involved in the genesis, proliferation and apoptosis of many malignancies, and even in the whole process of tumorigenesis (Liu Z, et al., 2018). PI3K-Akt is also gaining attention as a potential therapeutic target against a variety of cancers.
In this study, MAPK1 and EGFR were positioned as the most concluded hub genes. MAPK1 belongs to the MAP kinase family, which is extensively involved in cell differentiation, proliferation, transcriptional development and regulatory processes (Jiang N, et al., 2020). As a potential target gene for miRNAs, MAPK1 has been reported to be extensively involved in the development of tumor in several studies. Various miRNAs are involved in the progression of several cancers by targeting MAPK1, including pancreatic cancer (Yoon S and Seger R, 2006), bladder cancer (Huang FT, et al., 2017) and endometrial cancer (Noguchi S, et al., 2013). In the present study, it was suggested that MAPK1 may play a role in the process of BCC by PPI network analysis, but this finding needs to be verified in further experiments. EGFR is considered as an oncogenic driver and there is substantial evidence that EGFR is involved in the pathogenesis and progression of various cancers (Chang L, et al., 2017). Previous studies have shown that significant EGFR expression in BCC is associated with BCC aggressiveness and tumor differentiation to different histological subtypes (Rajaram P, et al., 2017), but the mechanism of its action in BCC is unclear.
The relationship between the virus and BCC is another finding of this study. Virus-associated miRNAs were significantly down-regulated in the lesioned area compared to the adjacent non-lesioned skin tissue of BCC, including miRNAs of HCMV, HSV1, HSV2 and KSHV. Meanwhile, KEGG pathway analysis revealed a high enrichment of DEGs in the HT-LV-I infection pathway. Previous studies have found HPV to be detected in BCC and suggest that it may play a role in BCC. However, the association of HCMV, HSV1, SHV2, KSHV and HTLV-I with BCC has not been reported in studies. Some studies have suggested that viral infections may be responsible for specific human cancers worldwide (Florescu DE, et al., 2018). HCMV is carried by the majority of the world’s population. It has been found to be present in gliomas and may play a role in gliomas through specific local tumor microenvironment or other pathways (Are C, et al., 2013; Singh P and Neumann DM, 2020). HSV1 and HSV2 belong to the two most common types of herpes simplex virus. HSV infections are common and widespread worldwide (Ding D, et al., 2014). HSV1 infections mostly occur in the oropharynx and have clinical symptoms similar to those of conventional infections. HSV2 infections mostly occur in the genitalia with symptoms of a herpes-like appearance. Although HSV infection has shown a trend of progressive increase and difficulty in control in recent years, there is no direct evidence of a direct relationship with the development of tumors. Although HSV infection has shown a trend of progressive increase and difficulty in control in recent years, there is no direct evidence of a direct relationship with the development of tumors. It is believed that KSHV (Kaposi Sarcoma-Associated Herpes Virus) infection can directly induce tumorigenesis through a complex interaction of multiple viruses, cellular angiogenesis and inflammatory markers (Rechenchoski DZ, et al., 2017). It is involved in the development and progression of a variety of malignancies including primary effusion lymphoma, Kaposi’s sarcoma and multicentric Castleman’s disease (Purushothaman P, et al., 2016). HTLV-I is the first pathogenic human retrovirus to be identified. In the past 30 years of research, HTLV-I is thought to be associated with a variety of malignancies, particularly non-Hodgkin lymphomas, kaposi sarcoma, and cervical cancer (Schulz TF and Cesarman E, 2015; Tagaya Y and Gallo RC, 2017). HTLV-I indirectly plays a role in cancer through microenvironmental or immune surveillance attenuation. In conclusion, these viruses may play a role in different types of tumors, but the exact mechanism or magnitude of the role is not well understood. In the present study, the mixed infection of multiple viruses in BCC tissues could be either an incidental opportunistic infection or a co-infection of multiple viruses playing a role in the development of BCC, which may be particularly associated with BCC expansion, further studies are needed.
Conclusion
In summary, based on the GEO database and bioinformatics analysis, we not only identified four miRNAs and two important hub genes that may be associated with BCC, but also suggested that viruses may play a role in BCC. These preliminary findings may serve as promising novel therapeutic targets and prognostic biomarkers for BCC. Our current study has some limitations. The small sample size we obtained from GSE34535 may produce some bias in the analysis of DE-miRNA. In addition, the predictions obtained based on bioinformatics analysis need to be validated in more cellular and animal experiments.
Data Availability
The data supporting the findings of this study are available from the corresponding author upon reasonable request.
Author’s Contribution
HL designed and completed all the study. The authors reviewed the final version of the manuscript and approved it for publication.
References
- Fania L, Didona D, Morese R, Campana I, Coco V, Pietro FR, et al. Basal cell carcinoma: From pathophysiology to novel therapeutic approaches. Biomedicines. 2020; 8(11): 449.
[Crossref] [Google scholar] [Pubmed]
- Lomas A, Leonardi-Bee J, Bath-Hextall F. A systematic review of worldwide incidence of nonmelanoma skin cancer. Br J Dermatol. 2012; 166(5): 1069-1680.
[Crossref] [Google scholar] [Pubmed]
- Ciążyńska M, Narbutt J, Woźniacka A, Lesiak A. Trends in basal cell carcinoma incidence rates: A 16-year retrospective study of a population in central Poland. Postepy Dermatol Alergol. 2018; 35(1): 47-52.
[Crossref] [Google scholar] [Pubmed]
- Dika E, Scarfì F, Ferracin M, Broseghini E, Marcelli E, Bortolani B, et al. Basal cell carcinoma: A comprehensive review. Int J Mol Sci. 2020; 21(15): 5572.
[Crossref] [Google scholar] [Pubmed]
- Dika E, Veronesi G, Patrizi A, de Salvo S, Misciali C, Baraldi C, et al. It's time for Mohs: Micrographic surgery for the treatment of high-risk basal cell carcinomas of the head and neck regions. Dermatol Ther. 2020; 33(4): e13474.
[Crossref] [Google scholar] [Pubmed]
- Peris K, Licitra L, Ascierto PA, Corvò R, Simonacci M, Picciotto F, et al. Identifying locally advanced basal cell carcinoma eligible for treatment with vismodegib: An expert panel consensus. Future Oncol. 2015; 11(4): 703-712.
[Crossref] [Google scholar] [Pubmed]
- Atwood SX, Chang AL, Oro AE. Hedgehog pathway inhibition and the race against tumor evolution. J Cell Biol. 2012; 199(2): 193-197.
[Crossref] [Google scholar] [Pubmed]
- Sekulic A, Migden MR, Oro AE, Dirix L, Lewis KD, Hainsworth JD, et al. Efficacy and safety of vismodegib in advanced basal-cell carcinoma. N Engl J Med. 2012; 366(23): 2171-2179.
[Crossref] [Google scholar] [Pubmed]
- Calin GA, Croce CM. MicroRNA signatures in human cancers. Nat Rev Cancer. 2006; 6(11): 857-866.
[Crossref] [Google scholar] [Pubmed]
- Sand M, Skrygan M, Sand D, Georgas D, Hahn SA, Gambichler T, et al. Expression of microRNAs in basal cell carcinoma. Br J Dermatol. 2012; 167(4): 847-855.
[Crossref] [Google scholar] [Pubmed]
- Heffelfinger C, Ouyang Z, Engberg A, Leffell DJ, Hanlon AM, Gordon PB, et al.Correlation of global microRNA expression with basal cell carcinoma subtype. G3 (Bethesda). 2012; 2(2): 279-286.
[Crossref] [Google scholar] [Pubmed]
- Sand M, Bechara FG, Gambichler T, Sand D, Friedländer MR, Bromba M, et al. Next-generation sequencing of the basal cell carcinoma miRNome and a description of novel microRNA candidates under neoadjuvant vismodegib therapy: An integrative molecular and surgical case study. Ann Oncol. 2016; 27(2): 332-338.
[Crossref] [Google scholar] [Pubmed]
- Yang Q, Hou C, Huang D, Zhuang C, Jiang W, Geng Z, et al. miR-455-5p functions as a potential oncogene by targeting galectin-9 in colon cancer. Oncol lett. 2017; 13(3): 1958-1964.
[Crossref] [Google scholar] [Pubmed]
- Bi H, Shang Z, Jia C, Wu J, Cui B, Wang Q, et al. LncRNA RNF144A-AS1 promotes bladder cancer progression via RNF144A-AS1/miR-455-5p/SOX11 axis. Onco Targets Ther. 2020; 13: 11277-11288.
[Crossref] [Google scholar] [Pubmed]
- Zakrzewska K, Regalbuto E, Pierucci F, Arvia R, Mazzoli S, Gori A, et al. Pattern of HPV infection in basal cell carcinoma and in perilesional skin biopsies from immunocompetent patients. Virol J. 2012; 9: 309.
[Crossref] [Google scholar] [Pubmed]
- Chen W, Li Q, Zhang G, Wang H, Zhu Z, Chen L. LncRNA HOXA-AS3 promotes the malignancy of glioblastoma through regulating miR-455-5p/USP3 axis. J cell Mol Med. 2020; 24(20): 11755-11767.
[Crossref] [Google scholar] [Pubmed]
- Cao J, Wang H, Liu G, Tang R, Ding Y, Xu P, et al. LBX2-AS1 promotes ovarian cancer progression by facilitating E2F2 gene expression via miR-455-5p and miR-491-5p sponging. J Cell Mol Med. 2021; 25(2): 1178-89.
[Crossref] [Google scholar] [Pubmed]
- Wang H, Li ZY, Xu ZH, Chen YL, Lu ZY, Shen DY, et al. The prognostic value of miRNA-18a-5p in clear cell renal cell carcinoma and its function via the miRNA-18a-5p/HIF1A/PVT1 pathway. J Cancer. 2020; 11(10): 2737-2748.
[Crossref] [Google scholar] [Pubmed]
- Kim SY, Kawaguchi T, Yan L, Young J, Qi Q, Takabe K. Clinical relevance of microRNA expressions in breast cancer validated using the cancer genome atlas (TCGA). Ann of Surg Oncol. 2017; 24(10): 2943-2949.
[Crossref] [Google scholar] [Pubmed]
- Noor MT, Seehra N, Rajput J, Sharma R, Thakur BS. Evaluation of roles of microRNA-21 and microRNA-18a in esophageal squamous cell carcinoma and comparison of their changes in expression post-chemo radiotherapy. Gastroenterology Res. 2020; 13(3): 107-113.
[Crossref] [Google scholar] [Pubmed]
- Jiao W, Zhang J, Wei Y, Feng J, Ma M, Zhao H, et al. MiR-139-5p regulates VEGFR and downstream signaling pathways to inhibit the development of esophageal cancer. Dig Liver Dis. 2019; 51(1): 149-156.
[Crossref] [Google scholar] [Pubmed]
- Jiang Q, Cao Y, Qiu Y, Li C, Liu L, Xu G. Progression of squamous cell carcinoma is regulated by miR-139-5p/CXCR4. Front Biosci (Landmark Ed). 2020; 25: 1732-1745.
[Crossref] [Google scholar] [Pubmed]
- Chen J, Yu Y, Chen X, He Y, Hu Q, Sun R, et al. MiR-139-5p is associated with poor prognosis and regulates glycolysis by repressing PKM2 in gallbladder carcinoma. Cell Prolif. 2018; 51(6): e12510.
[Crossref] [Google scholar] [Pubmed]
- Zhang HD, Sun DW, Mao L, Zhang J, Jiang LH, Li J, et al. MiR-139-5p inhibits the biological function of breast cancer cells by targeting Notch1 and mediates chemosensitivity to docetaxel. Biochem Biophys Res Commun. 2015; 465(4): 702-713.
[Crossref] [Google scholar] [Pubmed]
- Gao G, Tian Z, Zhu HY, Ouyang XY. miRNA-133b targets FGFR1 and presents multiple tumor suppressor activities in osteosarcoma. Cancer Cell Int. 2018; 18: 210.
[Crossref] [Google scholar] [Pubmed]
- Rotelli MT, Refolo MG, Lippolis C, Cavallini A, Picciariello A, Piscitelli D, et al. The role of miRNA-133b and its target gene SIRT1 in FAP-derived desmoid tumor. Oncotarget. 2020; 11(26): 2484-2492.
[Crossref] [Google scholar] [Pubmed]
- Zhou W, Bi X, Gao G, Sun L. miRNA-133b and miRNA-135a induce apoptosis via the JAK2/STAT3 signaling pathway in human renal carcinoma cells. Biomed Pharmacother. 2016; 84: 722-729.
[Crossref] [Google scholar] [Pubmed]
- Liu Z, Li W, Pang Y, Zhou Z, Liu S, Cheng K, et al. SF3B4 is regulated by microRNA-133b and promotes cell proliferation and metastasis in hepatocellular carcinoma. EBioMedicine. 2018; 38: 57-68.
[Crossref] [Google scholar] [Pubmed]
- Jiang N, Dai Q, Su X, Fu J, Feng X, Peng J. Role of PI3K/AKT pathway in cancer: The framework of malignant behavior. Mol Bio Rep. 2020; 47(6): 4587-4629.
[Crossref] [Google scholar] [Pubmed]
- Yoon S, Seger R. The extracellular signal-regulated kinase: Multiple substrates regulate diverse cellular functions. Growth Factors. 2006; 24(1): 21-44.
[Crossref] [Google scholar] [Pubmed]
- Huang FT, Peng JF, Cheng WJ, Zhuang YY, Wang LY, Li CQ, et al. MiR-143 targeting TAK1 attenuates pancreatic ductal adenocarcinoma progression via MAPK and NF-κB pathway in vitro. Dig Dis Sci. 2017; 62(4): 944-957.
[Crossref] [Google scholar] [Pubmed]
- Noguchi S, Yasui Y, Iwasaki J, Kumazaki M, Yamada N, Naito S, et al. Replacement treatment with microRNA-143 and -145 induces synergistic inhibition of the growth of human bladder cancer cells by regulating PI3K/Akt and MAPK signaling pathways. Cancer Lett. 2013; 328(2): 353-361.
- Chang L, Zhang D, Shi H, Bian Y, Guo R. MiR-143 inhibits endometrial cancer cell proliferation and metastasis by targeting MAPK1. Oncotarget. 2017; 8(48): 84384-84395.
[Crossref] [Google scholar] [Pubmed]
- Rajaram P, Chandra P, Ticku S, Pallavi BK, Rudresh KB, Mansabdar P. Epidermal growth factor receptor: Role in human cancer. Indian J Dent Res. 2017; 28(6): 687-694.
[Crossref] [Google scholar] [Pubmed]
- Florescu DE, Stepan AE, Mărgăritescu C, Ciurea RN, Stepan MD, Simionescu CE. The involvement of EGFR, HER2 and HER3 in the basal cell carcinomas aggressiveness. Rom J Morphol Embryol. 2018; 59(2): 479-484.
[Google scholar] [Pubmed]
- Are C, Rajaram S, Are M, Raj H, Anderson BO, Chaluvarya SR, et al. A review of global cancer burden: Trends, challenges, strategies, and a role for surgeons. J Surg Oncol. 2013; 107(2): 221-226.
[Crossref] [Google scholar] [Pubmed]
- Singh P, Neumann DM.Persistent HCMV infection of a glioblastoma cell line contributes to the development of resistance to temozolomide. Virus Res. 2020; 276: 197829.
[Crossref] [Google scholar] [Pubmed]
- Ding D, Han S, Wang Z, Guo Z, Wu A.Does the existence of HCMV components predict poor prognosis in glioma? J Neurooncol. 2014; 116(3): 515-522.
[Crossref] [Google scholar] [Pubmed]
- Rechenchoski DZ, Faccin-Galhardi LC, Linhares R, Nozawa C. Herpesvirus: An underestimated virus. Folia Microbiol (Praha). 2017; 62(2): 151-156.
[Crossref] [Google scholar] [Pubmed]
- Purushothaman P, Uppal T, Sarkar R, Verma SC. KSHV-mediated angiogenesis in tumor progression. Viruses. 2016; 8(7): 198.
[Crossref] [Google scholar] [Pubmed]
- Schulz TF, Cesarman E.Kaposi sarcoma-associated herpesvirus: Mechanisms of oncogenesis. Curr Opin Virol. 2015; 14: 116-128.
[Crossref] [Google scholar] [Pubmed]
- Tagaya Y, Gallo RC. The exceptional oncogenicity of HTLV-1. Front Microbiol. 2017; 8: 1425.
[Crossref] [Google scholar] [Pubmed]
Author Info
Hao Liu*Citation: Liu H: Identification of the Key miRNAs and Target Genes in Basal Cell Carcinoma by Bioinformatics Analysis
Received: 30-Jun-2022 Accepted: 22-Jul-2022 Published: 29-Jul-2022, DOI: 10.31858/0975-8453.13.7.443-450
Copyright: This is an open access article distributed under the terms of the Creative Commons Attribution License, which permits unrestricted use, distribution, and reproduction in any medium, provided the original work is properly cited.
ARTICLE TOOLS
- Dental Development between Assisted Reproductive Therapy (Art) and Natural Conceived Children: A Comparative Pilot Study Norzaiti Mohd Kenali, Naimah Hasanah Mohd Fathil, Norbasyirah Bohari, Ahmad Faisal Ismail, Roszaman Ramli SRP. 2020; 11(1): 01-06 » doi: 10.5530/srp.2020.1.01
- Psychometric properties of the World Health Organization Quality of life instrument, short form: Validity in the Vietnamese healthcare context Trung Quang Vo*, Bao Tran Thuy Tran, Ngan Thuy Nguyen, Tram ThiHuyen Nguyen, Thuy Phan Chung Tran SRP. 2020; 11(1): 14-22 » doi: 10.5530/srp.2019.1.3
- A Review of Pharmacoeconomics: the key to “Healthcare for All” Hasamnis AA, Patil SS, Shaik Imam, Narendiran K SRP. 2019; 10(1): s40-s42 » doi: 10.5530/srp.2019.1s.21
- Deuterium Depleted Water as an Adjuvant in Treatment of Cancer Anton Syroeshkin, Olga Levitskaya, Elena Uspenskaya, Tatiana Pleteneva, Daria Romaykina, Daria Ermakova SRP. 2019; 10(1): 112-117 » doi: 10.5530/srp.2019.1.19
- Dental Development between Assisted Reproductive Therapy (Art) and Natural Conceived Children: A Comparative Pilot Study Norzaiti Mohd Kenali, Naimah Hasanah Mohd Fathil, Norbasyirah Bohari, Ahmad Faisal Ismail, Roszaman Ramli SRP. 2020; 11(1): 01-06 » doi: 10.5530/srp.2020.1.01
- Manilkara zapota (L.) Royen Fruit Peel: A Phytochemical and Pharmacological Review Karle Pravin P, Dhawale Shashikant C SRP. 2019; 10(1): 11-14 » doi: 0.5530/srp.2019.1.2
- Pharmacognostic and Phytopharmacological Overview on Bombax ceiba Pankaj Haribhau Chaudhary, Mukund Ganeshrao Tawar SRP. 2019; 10(1): 20-25 » doi: 10.5530/srp.2019.1.4
- A Review of Pharmacoeconomics: the key to “Healthcare for All” Hasamnis AA, Patil SS, Shaik Imam, Narendiran K SRP. 2019; 10(1): s40-s42 » doi: 10.5530/srp.2019.1s.21
- A Prospective Review on Phyto-Pharmacological Aspects of Andrographis paniculata Govindraj Akilandeswari, Arumugam Vijaya Anand, Palanisamy Sampathkumar, Puthamohan Vinayaga Moorthi, Basavaraju Preethi SRP. 2019; 10(1): 15-19 » doi: 10.5530/srp.2019.1.3

