Research Article - (2024) Volume 15, Issue 2
Abstract
Background: Hyperuricemia is related to various cardiometabolic diseases in US adults, having an increasingly substantial impact on healthcare resources and costs. Nonetheless, there are limited studies examining the association between Atherogenic Index of Plasma (AIP) and hyperuricemia in middle-aged and elderly individuals.
Methods: We carried out a cross-sectional research study using data obtained from the National Health and Nutrition Examination Survey (NHANES). All 12,261 participants were classified according to the AIP quartiles. Participants aged <18 years, without Body Mass Index (BMI), waist, blood pressure, stringent Complete Response (sCR), Triglycerides (TG), HDL-C, LDL-C data, alcohol use, and smoking behavior information were excluded. AIP is calculated as the log TG to High-Density Lipoprotein Cholesterol (HDL-C) (Log[TG/HDL-C]). We explored the association between AIP and the risk of hyperuricemia using multivariate ordinal logistic regression. Hyperuricemia is widely defined as serum uric acid levels that are at or above 360 mmol/l in women and 420 mmol/l in men.
Results: Among 12261 participants included (mean age, 48.0 years), 6080 were male. The prevalence of hyperuricemia was 20.73% in the cross-sectional study. The multivariate-adjusted Hazard Ratios (HRs) and 95% Confidence Interval (CI) for hyperuricemia gradually and significantly increased with the AIP quartiles (1.26 (1.06, 1.49) in Q2, 1.63 (1.39, 1.93) in Q3, and 2.06 (1.76, 2.43) in Q4), following an adjustment for potential confounders. And we observed a non-linear dose-response and a consistent relationship between them after the interaction test stratified by age, sex, BMI, hypertension, diabetes, smoking, and alcohol.
Conclusion: On a continuous scale, per 1 unit increase in AIP was associated with multivariable-adjusted odds ratios (95% CI) of 2.06 (1.76, 2.43) for having a higher risk of hyperuricemia. These findings suggested the potential of AIP as an independent risk indicator in preventing hyperuricemia.
Keywords
Atherogenic index of plasma, Hyperuricemia, NHANES
Abbreviations
NHANES: National Health and Nutrition Examination Survey; AIP: Atherogenic Index of Plasma; BMI: Body Mass Index; SBP: Systolic Blood Pressure; DBP: Diastolic Blood Pressure; TC: Total Cholesterol; LDL-C: Low-Density Lipoprotein-Cholesterol; eGFR: Estimated Glomerular Filtration Rate
Introduction
The prevalence of hyperuricemia has been increasing over and over the years. This condition has far-reaching implications for the overall well-being of the population and has a substantial impact on healthcare resources and costs (GBD 2019 viewpoint collaborators, 2020). In addition, there have been observations suggesting a shift towards a younger population being affected by this condition. The overall hyperuricemia prevalence in the United States of America, adult population was 16.9% (Chen‐Xu M, et al., 2019). It is one of the leading preventable causes of morbidity and mortality in the world. High level of uric acid is related to various cardiovascular and renal diseases.
The relationship between abnormal lipid levels and a range of health conditions, including cardiovascular diseases, diabetes, Chronic Kidney Disease (CHD), and hyperuricemia, has been extensively studied. Previous research has indicated that the ratio of different lipids, rather than individual lipid values alone, can serve as a better predictor of CHD (Kastelein JJ, et al., 2008; Hsia SH, et al., 2006). For instance, Zhu L, et al., 2015 found that lipoprotein ratios are more effective than traditional lipid measurements for predicting coronary heart disease in the Chinese Han population. The AIP, introduced by Dobiasova M and Frohlich J, 2000 is calculated as the logarithmically transformed ratio of Triglycerides (TG) to HDL-C. AIP has been shown to correlate well (r=-0.776) with small, dense Low-Density Lipoprotein (sdLDL) particles and is considered a superior predictor of cardiovascular risk compared to traditional lipid parameters (Bikov A, et al., 2021; Li YW, et al., 2021). Other studies also showed that AIP has been seen as a better predictive biomarker of CVD, hypertension, diabetes, artery calcification, Obstructive Sleep Apnoea (OSA), and other cardiometabolic diseases in increasing studies (Dobiasova M and Frohlich J, 2000; Li YW, et al., 2021; Dobiasova M, 2006; Won KB, et al., 2020; Nansseu JR , et al., 2016; Edwards MK, et al., 2017). However, there is limited available data specifically examining the association between AIP and hyperuricemia. It is important to determine whether AIP influences the risk of hyperuricemia, particularly in USA adults. By conducting studies that specifically investigate this association, researchers can gain insights into whether AIP can be seen as a potential biomarker for hyperuricemia risk assessment. Understanding this relationship may contribute to improved risk stratification and preventive strategies for hyperuricemia and its associated conditions.
Materials and Methods
Study design and population
We collected all data from the 2005-2016 National Health and Nutrition Examination Survey (NHANES) database. The NHANES is an ongoing survey that uses a complex and multi-stage probability sampling method to choose a representative sample of people in the USA. The research protocol for NHANES has received approval and all individuals participating in the study have provided written informed consent (for more detailed information, refer www.cdc.gov/nchs/nhanes/irba98.htm). A total of 60936 participants were included initially. And then we excluded children and teenagers (aged <18 years old) and participants without BMI, waist, blood pressure, SCr, TG, HDL-C, LDL-C, alcohol use, and smoking behavior. In the end, there were a total of 1,2261 participants in this study (Figure 1).
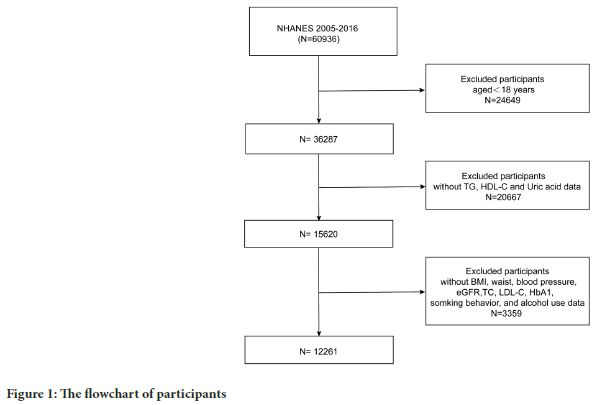
Figure 1: The flowchart of participants
Definitions of included variables
The exposure variable was the AIP, which was calculated as a logarithm (base 10) of the ratio between triglyceride levels and high-density lipoprotein cholesterol levels in mmol/l (Onat A, et al., 2010). Furthermore, hyperuricemia was defined as having uric acid levels equal to or >420 mmol/l in males and equal to or greater than 360 mmol/l in females (Feig DI, et al., 2008).
Covariates
We collect all covariates, such as continuous variables (age, body mass index (BMI, kg/m2 ), waist circumference (cm), Systolic Blood Pressure (SBP, mmHg), Diastolic Blood Pressure (DBP, mmHg), Triglycerides (TG, mg/ dl), Total Cholesterol (TC, mg/dl), Low-Density Lipoprotein-Cholesterol (LDL-C, mg/dl), High-Density Lipoprotein-Cholesterol (HDL-C, mg/ dl), estimated Glomerular Filtration Rate (eGFR, ml/min/1.73 m2), and Hemoglobin A1c (HbA1c) and categorical variables (sex, race, hyphenation, diabetes, smoking behavior, alcohol intake). The interviews collected demographic information on age, sex race, smoking status, alcohol intake, hypertension, and, diabetes. Smoking status was divided into current smoker, never smoker (smoked less than 100 cigarettes in life), and former smoker (smoked over 100 cigarettes but not still smoking recently). Drinking status was categorized into never drinker (drunk <12 times in a lifetime), current drinker (drunk ≥ 12 times in a lifetime and still drinking recently), and former drinker (drunk ≥ 12 times in life but did not drink last year). Diabetes Mellitus (DM) was defined as having a diagnosis of diabetes, fasting glucose (mmol/l) ≥ 7.0, glycohemoglobin HbA1c (%) >6.5, random blood glucose (mmol/l) ≥ 11.1, or taking antidiabetic medications. We defined hypertension if any of these criteria are met: (1) having a diagnosis of hypertension; (2) having three consecutive systolic blood pressure measurements≥140 mmHg or diastolic blood pressure≥90 mmHg; (3) taking antihypertensive medications.
Regarding the definition of HUA, males with serum Uric Acid (UA) levels greater than 420 µmol/l (7 mg/dl) and females greater than 360 µmol/l (6 mg/dl) are commonly used as diagnostic criteria for hyperuricemia (Feig DI, et al., 2008).
All statistical analysis was conducted using R, version 4.2.0 (R Foundation) and EmpowerStats (http://www.empowerstats.com, X and Y Solutions, Inc., Boston, MA).
To examine the association between AIP (Atherogenic Index of Plasma) and hyperuricemia among US adults, we utilized multivariate logistic regression analysis.
Model 1 represented the data adjusted for age, sex, and race. In Model 2, the data were adjusted for age, sex, race, BMI, waist circumference, SBP, DBP, LDL-C, TC, eGFR, HbA1, smoking behavior, and alcohol intake. The results from the logistic regression analysis are reported in the form of Odds Ratios (ORs) and 95% CI. Additionally, the effect dose response between the AIP and hyperuricemia was evaluated by a generalized additive model and fitting curve (penalized spline method).
Results
Baseline characteristics of participants
The average age of participants is 48 years old. The prevalence of hyperuricemia was 20.73% in the cross-sectional study. The baseline characteristics of 12,261 participants according to AIP quartiles (Q1 ≤ 0.07; Q2: 0.07-0.29; Q3: 0.29-0.51; Q4: ≥ 0.51) are shown in Table 1. There were statistically significant differences by sex, race, age, BMI, waist circumference, SBP, DBP, diabetes, hypertension, eGFR, TC, LDL-C, HbA1c, and smoking behavior (all p<0.001) apart from the alcohol use among the AIP quartiles (Table 1). It appears that the Q4 group consists of older males who are still smoking and have the highest levels of several indicators, including SBP, DBP, eGFR, TC, LDL-C, and HbA1c. Additionally, it is mentioned that this group has a higher risk of hypertension and diabetes compared to the other groups.
| Variables | AIP quartiles | p-value | |||
|---|---|---|---|---|---|
| Q1 (≤ 0.07) | Q2 (0.07-0.29) | Q3 (0.29-0.51) | Q4 (≥ 0.51) | ||
| Participants | 3065 | 3064 | 3065 | 3067 | |
| Male, n (%) | 1151 (37.55%) | 1443 (47.10%) | 1592 (51.94%) | 1894 (61.75%) | <0.001 |
| Age (years) | 45.14 ± 18.84 | 48.15 ± 19.12 | 49.77 ± 18.51 | 49.79 ± 17.08 | <0.001 |
| Race | <0.001 | ||||
| Non-Hispanic white, n (%) | 341 (11.13%) | 472 (15.40%) | 551 (17.98%) | 617 (20.12%) | |
| Non-Hispanic black, n (%) | 233 (7.60%) | 297 (9.69%) | 347 (11.32%) | 371 (12.10%) | |
| Mexican American, n (%) | 1207 (39.38%) | 1379 (45.01%) | 1357 (44.27%) | 1494 (48.71%) | |
| Other Hispanic, n (%) | 954 (31.13%) | 639 (20.86%) | 518 (16.90%) | 322 (10.50%) | |
| Other races, n (%) | 330 (10.77%) | 277 (9.04%) | 292 (9.53%) | 263 (8.58%) | |
| BMI, kg/m2 | 26.02 ± 6.13 | 28.28 ± 6.57 | 29.66 ± 6.55 | 31.10 ± 6.36 | <0.001 |
| Normal weight | 1589 (51.84%) | 1062 (34.66%) | 732 (23.88%) | 425 (13.86%) | |
| Overweight | 873 (28.48%) | 1020 (33.29%) | 1092 (35.63%) | 1095 (35.70%) | |
| Obese | 603 (19.67%) | 982 (32.05%) | 1241 (40.49%) | 1547 (50.44%) | |
| Waist circumference (cm) | 90.05 ± 14.83 | 96.82 ± 15.52 | 101.06 ± 15.36 | 105.88 ± 14.99 | <0.001 |
| SBP (mmHg) | 120.15 ± 18.07 | 123.13 ± 19.16 | 124.54 ± 18.25 | 126.16 ± 17.81 | <0.001 |
| DBP (mmHg) | 67.10 ± 12.57 | 67.82 ± 12.82 | 69.13 ± 13.00 | 71.07 ± 13.35 | <0.001 |
| Smoking behavior | <0.001 | ||||
| Never | 1879 (61.31%) | 1709 (55.78%) | 1635 (53.34%) | 1504 (49.04%) | |
| Ever | 562 (18.34%) | 623 (20.33%) | 674 (21.99%) | 697 (22.73%) | |
| Now | 624 (20.36%) | 732 (23.89%) | 756 (24.67%) | 866 (28.24%) | |
| Alcohol intake | 0.824 | ||||
| Never | 454 (14.81%) | 455 (14.85%) | 454 (14.81%) | 435 (14.18%) | |
| Ever | 402 (13.12%) | 438 (14.30%) | 427 (13.93%) | 417 (13.60%) | |
| Now | 2209 (72.07%) | 2171 (70.86%) | 2184 (71.26%) | 2215 (72.22%) | |
| Hypertension | 993 (32.40%) | 1215 (39.65%) | 1364 (44.50%) | 1532 (49.95%) | <0.001 |
| Diabetes | 745 (24.31%) | 969 (31.63%) | 1106 (36.08%) | 1320 (43.04%) | <0.001 |
| TC (mg/dl) | 182.51 ± 37.38 | 187.55 ± 39.00 | 192.90 ± 41.69 | 202.62 ± 42.61 | <0.001 |
| LDL-C (mg/dl) | 101.27 ± 30.29 | 109.20 ± 68.31 | 107.77 ± 57.04 | 114.01 ± 80.81 | <0.001 |
| eGFR (ml/min/1.73 m2) | 105.03 ± 63.12 | 109.20 ± 68.31 | 107.77 ± 57.04 | 114.01 ± 80.81 | <0.001 |
| HbA1 | 5.47 ± 0.68 | 5.62 ± 0.91 | 5.77 ± 1.10 | 5.94 ± 1.26 | <0.001 |
| Hyperuricemia | |||||
| No | 2744 (89.53%) | 2545 (83.06%) | 2355 (76.84%) | 2075 (67.66%) | <0.001 |
| Yes | 321 (10.47%) | 519 (16.94%) | 710 (23.16%) | 992 (32.34%) | |
Table 1: The characteristics of participants according to atherogenic index of plasma
The association between AIP and uric acid
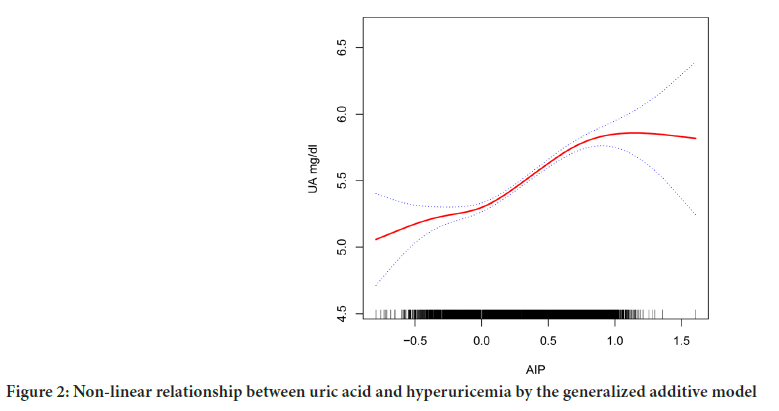
In model 2, having fully adjusted for age, sex, race, blood pressure, smoking, drinking, BMI, urea, creatinine, triglyceride, Low-Density Lipoprotein Cholesterol (LDL-C), glycosylated hemoglobin, eGFR, history of diabetes, history of hypertension, the smoking behavior and alcohol use. Q4 was 0.42 units higher than Q1 (β=0.42, 95% CI: 0.36, 0.48; p<0.001). As a result of smooth curve fitting, we observed a significant non-linear relationship between AIP and hyperuricemia (p<0.001) (Figure 2).
Figure 2: Non-linear relationship between uric acid and hyperuricemia by the generalized additive model
Association between AIP and hyperuricemia
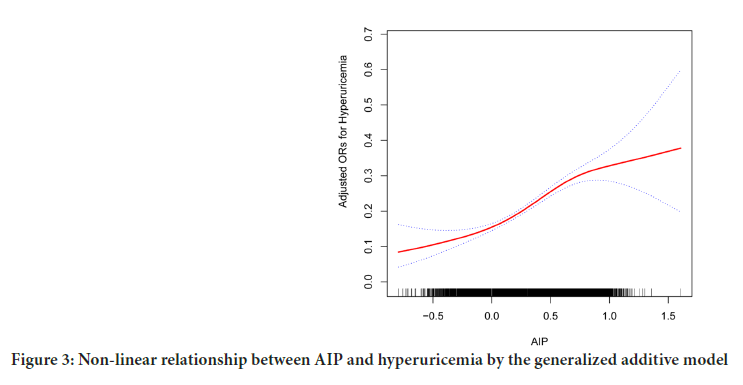
We found the relationship between AIP levels and hyperuricemia with multivariate logistic regression analysis. After adjusting for demographic characteristics, the AIP had a positive correlation with hyperuricemia in model 2 (p<0.0001) (Table 2), the relative odds of hyperuricemia of the participants in the all groups increased [Q4 vs.Q1 (95% CI): 2.06 (1.76, 2.43), p<0.001]. As a result of smooth curve fitting, we observed a significant non-linear relationship between AIP and hyperuricemia (p<0.001) (Figure 3).
| AIP | β1/OR (95% CI), p-value | ||
|---|---|---|---|
| Crude model | Model 1 | Model 2 | |
| Uric acid (mg/dl) | |||
| Continuous | 1.42 (1.34, 1.49)<0.0001 | 1.13 (1.06, 1.20)<0.0001 | 0.52 (0.45, 0.59)<0.0001 |
| Categories | |||
| Quartile 1 | - | - | - |
| Quartile 2 | 0.43 (0.36,0.50)*** | 0.34 (0.28, 0.40)*** | 0.11 (0.06, 0.17)*** |
| Quartile 3 | 0.72 (0.66, 0.79)*** | 0.58 (0.52,0.64)*** | 0.25 (0.19, 0.31)*** |
| Quartile 4 | 1.15 (1.09, 1.22)*** | 0.92 (0.86, 0.99)*** | 0.42 (0.36, 0.48)*** |
| p-value | <0.0001 | <0.0001 | <0.0001 |
| Hyperuricemia (95% CI) | |||
| Continuous | 4.53 (4.76, 6.42)<0.0001 | 5.40 (5.45, 7.52)<0.0001 | 1.59 (2.16, 3.12)<0.0001 |
| Categories | |||
| Quartile 1 | 1 | 1 | 1 |
| Quartile 2 | 1.74 (1.50,2.02)*** | 1.80 (1.55, 2.10)*** | 1.26 (1.06, 1.49)** |
| Quartile 3 | 2.58 (2.23, 2.97)*** | 2.71 (2.34, 3.14)*** | 1.63 (1.39, 1.93)*** |
| Quartile 4 | 4.09 (3.56, 4.69)*** | 4.55 (3.93, 5.26)*** | 2.06 (1.76, 2.43)*** |
| p-value | <0.0001 | <0.0001 | <0.0001 |
Note: ***<0.001 and **p<0.01. Model 1 was adjusted for age, gender and race; Model 2 was adjusted for age, gender, race, BMI, waist circumference, SBP, DBP, LDL-C, TC, eGFR, HbA1, smoking behavior and alcohol intake
Table 2: Association between atherogenic index of plasma and hyperuricemia
Figure 3: Non-linear relationship between AIP and hyperuricemia by the generalized additive model
Subgroup analysis
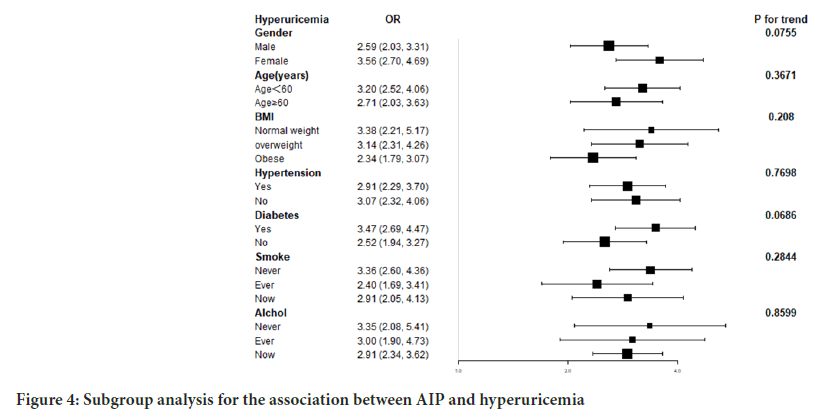
The subgroup analysis helped evaluate that there was a consistent association between AIP and hyperuricemia by the interaction test among different stratifications, implying that factors such as gender, age, BMI, hypertension, diabetes, smoking behavior, and alcohol use did not significantly influence the positive association (p>0.05) (Figure 4).
Figure 4: Subgroup analysis for the association between AIP and hyperuricemia
Discussion
In this cross-sectional study of 12,261 participants, we observed that 20.7% of US adults developed hyperuricemia, which is similar to the disease prevalence observed in previous studies (Chen‐Xu M, et al., 2019). There is a need to pay attention to exploring people with hyperuricemia, and then help us to prevent and treat to emerge cardiovascular complications, which harm to health and increase the burden.
In this study, we found that Individuals with a high AIP face a higher risk of developing hyperuricemia among adults in the US. Once all possible confounding factors were taken into account through adjustment, Individuals in the highest quartile of AIP were approximately twice as likely to develop hyperuricemia compared to those in the lowest quartile. AIP helps us to find people with high risk of hyperuricemia, which means that reducing triglyceride levels could potentially decrease the risk of developing hyperuricemia. In a survey of NHANES III, Peng TC, et al., 2015 indicated that serum uric acid levels were correlated with the levels of LDL, HDL, and apolipoprotein-B. This finding aligns with the results obtained by Hou YL, et al., 2019 and Zhang Y, et al., 2018. The above results indicated that we can use AIP as an indicator that predicts hyperuricemia.
Yin B, et al., 2023 found that the association of AIP with insulin resistance and type 2 diabetes is more pronounced in females compared to males. Also, Shi Y and Wen M, 2023 found that sex-specific differences in the effect of the atherogenic index of plasma on prediabetes and diabetes. However, in our study, we didn’t find the same difference, which means that AIP could be used for predicting the risk of hyperuricemia in US adults, not only for females.
We first assessed an association between AIP and hyperuricemia. Previous research has indicated that, in comparison to individuals in the lowest AIP group, those in the highest AIP group experienced a substantial 106% increase in the risk of developing hyperuricemia.
While the mechanism of how AIP contributes to hyperuricemia in patients remains unclear, the following biological mechanisms can provide some explanation. The AIP is calculated by combining TGs and HDL, so the levels of TG and HDL in the human body are closely related to the pathogenesis of hyperuricemia. Zhang Y, et al., 2018 found that elevated TG levels are independently linked to a higher risk of Liu XY, et al., 2020 found that The TG/HDL-C ratio exhibited a positive association with the likelihood of developing hyperuricemia in the Chinese population, especially among women and those with normal weight, which presented the same result as this study.
The first reason is that Low levels of HDL-C can indeed contribute to endothelial dysfunction, inflammation, and oxidative stress (Kontush A, 2014), which can result in damage the renal treatment of uric acid. Moreover, when TG levels are increased, such as in conditions like obesity or a high-fat diet, it can lead to downregulation or reduction in the number and activity of insulin receptors on adipocytes (Goodpaster BH and Kelley DE, 2002). Additionally, HDL-C is involved in maintaining the sensitivity and secretion of insulin from β-cells. Decreased levels of HDL-C can lead to a decline in β-cell function, resulting in reduced insulin sensitivity and secretion (Steiner G and Vranic M, 1982). IR has been suggested to be a contributor to hyperuricemia (Li F, et al., 2021). In the end, triglycerides indirectly promote hepatocyte injury, which plays a vital role in mediating uric acid homeostasis (Matsuura F, et al., 1998). Interestingly, AIP applied to US adults is a proper indicator for predicting hyperuricemia risk in males and females in our study. There is no significant difference between the two different genders.
Limitations
There is a restriction to establish a causal relationship between AIP and hyperuricemia in a cross-sectional design. More cohort studies are needed to confirm the association between the AIP and hyperuricemia. In addition, our study did not take into account several other factors that could potentially affect serum uric acid levels. These factors include physical activity levels, diets that are high in purine or fructose, the menopausal status of the participants, and any medications that the participants may have been taking concurrently.
Conclusion
From the cross-sectional study among 12,261 American adults, a positive correlation between AIP and hyperuricemia can be shown. The higher risk of hyperuricemia aligned with the increase in the AIP, without consideration for whether confounding factors were accounted for.
Ethical Approval and Consent to Participate
The NHANES protocols were approved by the National Center for Health Statistics Ethics Review Board of the US CDC, and written informed consent from all the participants was provided during the survey.
Author's Contributions
Xin Yang: Methodology implementation, formal analysis, writing-original draft, writing-review and editing. Pei-nan Chen: Validation. Bin Wu: Validation. Jie-ying Liao: Validation. Bingchun Shi: Validation. Yutao Li: Validation. Xu Yang: Conceptualization, methodology guidance, project administration, validation, writing-review and editing. The author(s) read and approved the final manuscript.
Funding
This study was supported by the Shantou Science and Technology Project (210624116490906).
Data Availability
The datasets analyzed during the current study are available on the NHANES official website, https://wwwn.cdc.gov/Nchs/Nhanes/
References
- GBD 2019 viewpoint collaborators. Five insights from the global burden of disease study 2019. Lancet. 2020; 396(10258): 1135-1159.
[Crossref] [Google Scholar] [Pubmed]
- Chen‐Xu M, Yokose C, Rai SK, Pillinger MH, Choi HK. Contemporary prevalence of gout and hyperuricemia in the United States and decadal trends: The national health and nutrition examination survey, 2007-2016. Arthritis Rheumatol. 2019; 71(6): 991-999.
[Crossref] [Google Scholar] [Pubmed]
- Kastelein JJ, van Der Steeg WA, Holme I, Gaffney M, Cater NB, Barter P, et al. Lipids, apolipoproteins, and their ratios in relation to cardiovascular events with statin treatment. Circulation. 2008; 117(23): 3002-3009.
[Crossref] [Google Scholar] [Pubmed]
- Hsia SH, Pan D, Berookim P, Lee ML. A population-based, cross-sectional comparison of lipid-related indexes for symptoms of atherosclerotic disease. Am J Cardiol. 2006; 98(8): 1047-1052.
[Crossref] [Google Scholar] [Pubmed]
- Zhu L, Lu Z, Zhu L, Ouyang X, Yang Y, He W, et al. Lipoprotein ratios are better than conventional lipid parameters in predicting coronary heart disease in Chinese Han people. Kardiol Pol. 2015; 73(10): 931-938.
[Crossref] [Google Scholar] [Pubmed]
- Dobiasova M, Frohlich J. The new atherogenic plasma index reflects the triglyceride and HDL-cholesterol ratio, the lipoprotein particle size and the cholesterol esterification rate: Changes during lipanor therapy. Vnitr Lek. 2000; 46(3): 152-156.
[Google Scholar] [Pubmed]
- Bikov A, Meszaros M, Kunos L, Negru AG, Frent SM, Mihaicuta S. Atherogenic index of plasma in obstructive sleep apnoea. J Clin Med. 2021; 10(3): 417.
[Crossref] [Google Scholar] [Pubmed]
- Li YW, Kao TW, Chang PK, Chen WL, Wu LW. Atherogenic index of plasma as predictors for metabolic syndrome, hypertension and diabetes mellitus in Taiwan citizens: A 9-year longitudinal study. Sci Rep. 2021; 11(1): 9900.
- Dobiasova M. AIP-atherogenic index of plasma as a significant predictor of cardiovascular risk: From research to practice. Vnitr Lek. 2006; 52(1): 64-71.
[Google Scholar] [Pubmed]
- Won KB, Han D, Lee JH, Choi SY, Chun EJ, Park SH, et al. Atherogenic index of plasma and coronary artery calcification progression beyond traditional risk factors according to baseline coronary artery calcium score. Sci Rep. 2020; 10(1): 21324.
[Crossref] [Google Scholar] [Pubmed]
- Nansseu JR, Ama Moor VJ, Nouaga ME, Zing-Awona B, Tchanana G, Ketcha A. Atherogenic index of plasma and risk of cardiovascular disease among Cameroonian postmenopausal women. Lipids Health Dis. 2016; 15(1): 1-5.
- Edwards MK, Blaha MJ, Loprinzi PD. Atherogenic index of plasma and triglyceride/high-density lipoprotein cholesterol ratio predict mortality risk better than individual cholesterol risk factors, among an older adult population. Mayo Clin Proc. 2017; 92(4): 680-681.
[Crossref] [Google Scholar] [Pubmed]
- Onat A, Can G, Kaya H. “Atherogenic index of plasma” (log10 triglyceride/high-density lipoprotein-cholesterol) predicts high blood pressure, diabetes, and vascular events. J Clin Lipidol. 2010; 4(2): 89-98.
[Crossref] [Google Scholar] [Pubmed]
- Feig DI, Kang DH, Johnson RJ. Uric acid and cardiovascular risk. N Engl J Med. 2008; 359(17): 1811-1821.
[Crossref] [Google Scholar] [Pubmed]
- Peng TC, Wang CC, Kao TW, Chan JY, Yang YH, Chang YW, et al. Relationship between hyperuricemia and lipid profiles in US adults. Biomed Res Int. 2015; 2015: 127596.
[Crossref] [Google Scholar] [Pubmed]
- Hou YL, Yang XL, Wang CX, Zhi LX, Yang MJ, You CG. Hypertriglyceridemia and hyperuricemia: A retrospective study of urban residents. Lipids Health Dis. 2019; 18(1): 1-5.
[Crossref] [Google Scholar] [Pubmed]
- Zhang Y, Wei F, Chen C, Cai C, Zhang K, Sun N, et al. Higher triglyceride level predicts hyperuricemia: A prospective study of 6-year follow-up. J Clin Lipidol. 2018; 12(1): 185-92.
[Crossref] [Google Scholar] [Pubmed]
- Yin B, Wu Z, Xia Y, Xiao S, Chen L, Li Y. Non-linear association of atherogenic index of plasma with insulin resistance and type 2 diabetes: A cross-sectional study. Cardiovasc Diabetol. 2023; 22(1): 157.
[Crossref] [Google Scholar] [Pubmed]
- Shi Y, Wen M. Sex-specific differences in the effect of the atherogenic index of plasma on prediabetes and diabetes in the NHANES 2011-2018 population. Cardiovasc Diabetol. 2023; 22(1): 1-8.
[Crossref] [Google Scholar] [Pubmed]
- Liu XY, Wu QY, Chen ZH, Yan GY, Lu Y, Dai HJ, et al. Elevated Triglyceride to High-Density Lipoprotein Cholesterol (TG/HDL-C) ratio increased risk of hyperuricemia: A 4-year cohort study in China. Endocrine. 2020; 68: 71-80.
[Crossref] [Google Scholar] [Pubmed]
- Kontush A. HDL-mediated mechanisms of protection in cardiovascular disease. Cardiovasc Res. 2014; 103(3): 341-349.
[Crossref] [Google Scholar] [Pubmed]
- Goodpaster BH, Kelley DE. Skeletal muscle triglyceride: Marker or mediator of obesity-induced insulin resistance in type 2 diabetes mellitus? Curr Diab Rep. 2002; 2(3): 216-222.
[Crossref] [Google Scholar] [Pubmed]
- Steiner G, Vranic M. Hyperinsulinemia and hypertriglyceridemia, a vicious cycle with atherogenic potential. Int J Obes. 1982; 6: 117-124.
[Google Scholar] [Pubmed]
- Li F, Chen S, Qiu X, Wu J, Tan M, Wang M. Serum uric acid levels and metabolic indices in an obese population: A cross-sectional study. Diabetes Metab Syndr Obes. 2021; 14: 627-635.
[Crossref] [Google Scholar] [Pubmed]
- Matsuura F, Yamashita S, Nakamura T, Nishida M, Nozaki S, Funahashi T, et al. Effect of visceral fat accumulation on uric acid metabolism in male obese subjects: Visceral fat obesity is linked more closely to overproduction of uric acid than subcutaneous fat obesity. Metabolism. 1998; 47(8): 929-933.
Author Info
Xin Yang, Pei-nan Chen, Bin Wu, Jie-ying Liao, Bingchun Shi, Yutao Li and Xu Yang*Citation: Yang X: Non-Linear Association of Atherogenic Index of Plasma with Hyperuricemia in US Adults: A Cross-Sectional Study
Received: 31-Jan-2024 Accepted: 15-Feb-2024 Published: 22-Feb-2024, DOI: 10.31858/0975-8453.15.2.67-73
Copyright: This is an open access article distributed under the terms of the Creative Commons Attribution License, which permits unrestricted use, distribution, and reproduction in any medium, provided the original work is properly cited.
ARTICLE TOOLS
- Dental Development between Assisted Reproductive Therapy (Art) and Natural Conceived Children: A Comparative Pilot Study Norzaiti Mohd Kenali, Naimah Hasanah Mohd Fathil, Norbasyirah Bohari, Ahmad Faisal Ismail, Roszaman Ramli SRP. 2020; 11(1): 01-06 » doi: 10.5530/srp.2020.1.01
- Psychometric properties of the World Health Organization Quality of life instrument, short form: Validity in the Vietnamese healthcare context Trung Quang Vo*, Bao Tran Thuy Tran, Ngan Thuy Nguyen, Tram ThiHuyen Nguyen, Thuy Phan Chung Tran SRP. 2020; 11(1): 14-22 » doi: 10.5530/srp.2019.1.3
- A Review of Pharmacoeconomics: the key to “Healthcare for All” Hasamnis AA, Patil SS, Shaik Imam, Narendiran K SRP. 2019; 10(1): s40-s42 » doi: 10.5530/srp.2019.1s.21
- Deuterium Depleted Water as an Adjuvant in Treatment of Cancer Anton Syroeshkin, Olga Levitskaya, Elena Uspenskaya, Tatiana Pleteneva, Daria Romaykina, Daria Ermakova SRP. 2019; 10(1): 112-117 » doi: 10.5530/srp.2019.1.19
- Dental Development between Assisted Reproductive Therapy (Art) and Natural Conceived Children: A Comparative Pilot Study Norzaiti Mohd Kenali, Naimah Hasanah Mohd Fathil, Norbasyirah Bohari, Ahmad Faisal Ismail, Roszaman Ramli SRP. 2020; 11(1): 01-06 » doi: 10.5530/srp.2020.1.01
- Manilkara zapota (L.) Royen Fruit Peel: A Phytochemical and Pharmacological Review Karle Pravin P, Dhawale Shashikant C SRP. 2019; 10(1): 11-14 » doi: 0.5530/srp.2019.1.2
- Pharmacognostic and Phytopharmacological Overview on Bombax ceiba Pankaj Haribhau Chaudhary, Mukund Ganeshrao Tawar SRP. 2019; 10(1): 20-25 » doi: 10.5530/srp.2019.1.4
- A Review of Pharmacoeconomics: the key to “Healthcare for All” Hasamnis AA, Patil SS, Shaik Imam, Narendiran K SRP. 2019; 10(1): s40-s42 » doi: 10.5530/srp.2019.1s.21
- A Prospective Review on Phyto-Pharmacological Aspects of Andrographis paniculata Govindraj Akilandeswari, Arumugam Vijaya Anand, Palanisamy Sampathkumar, Puthamohan Vinayaga Moorthi, Basavaraju Preethi SRP. 2019; 10(1): 15-19 » doi: 10.5530/srp.2019.1.3

